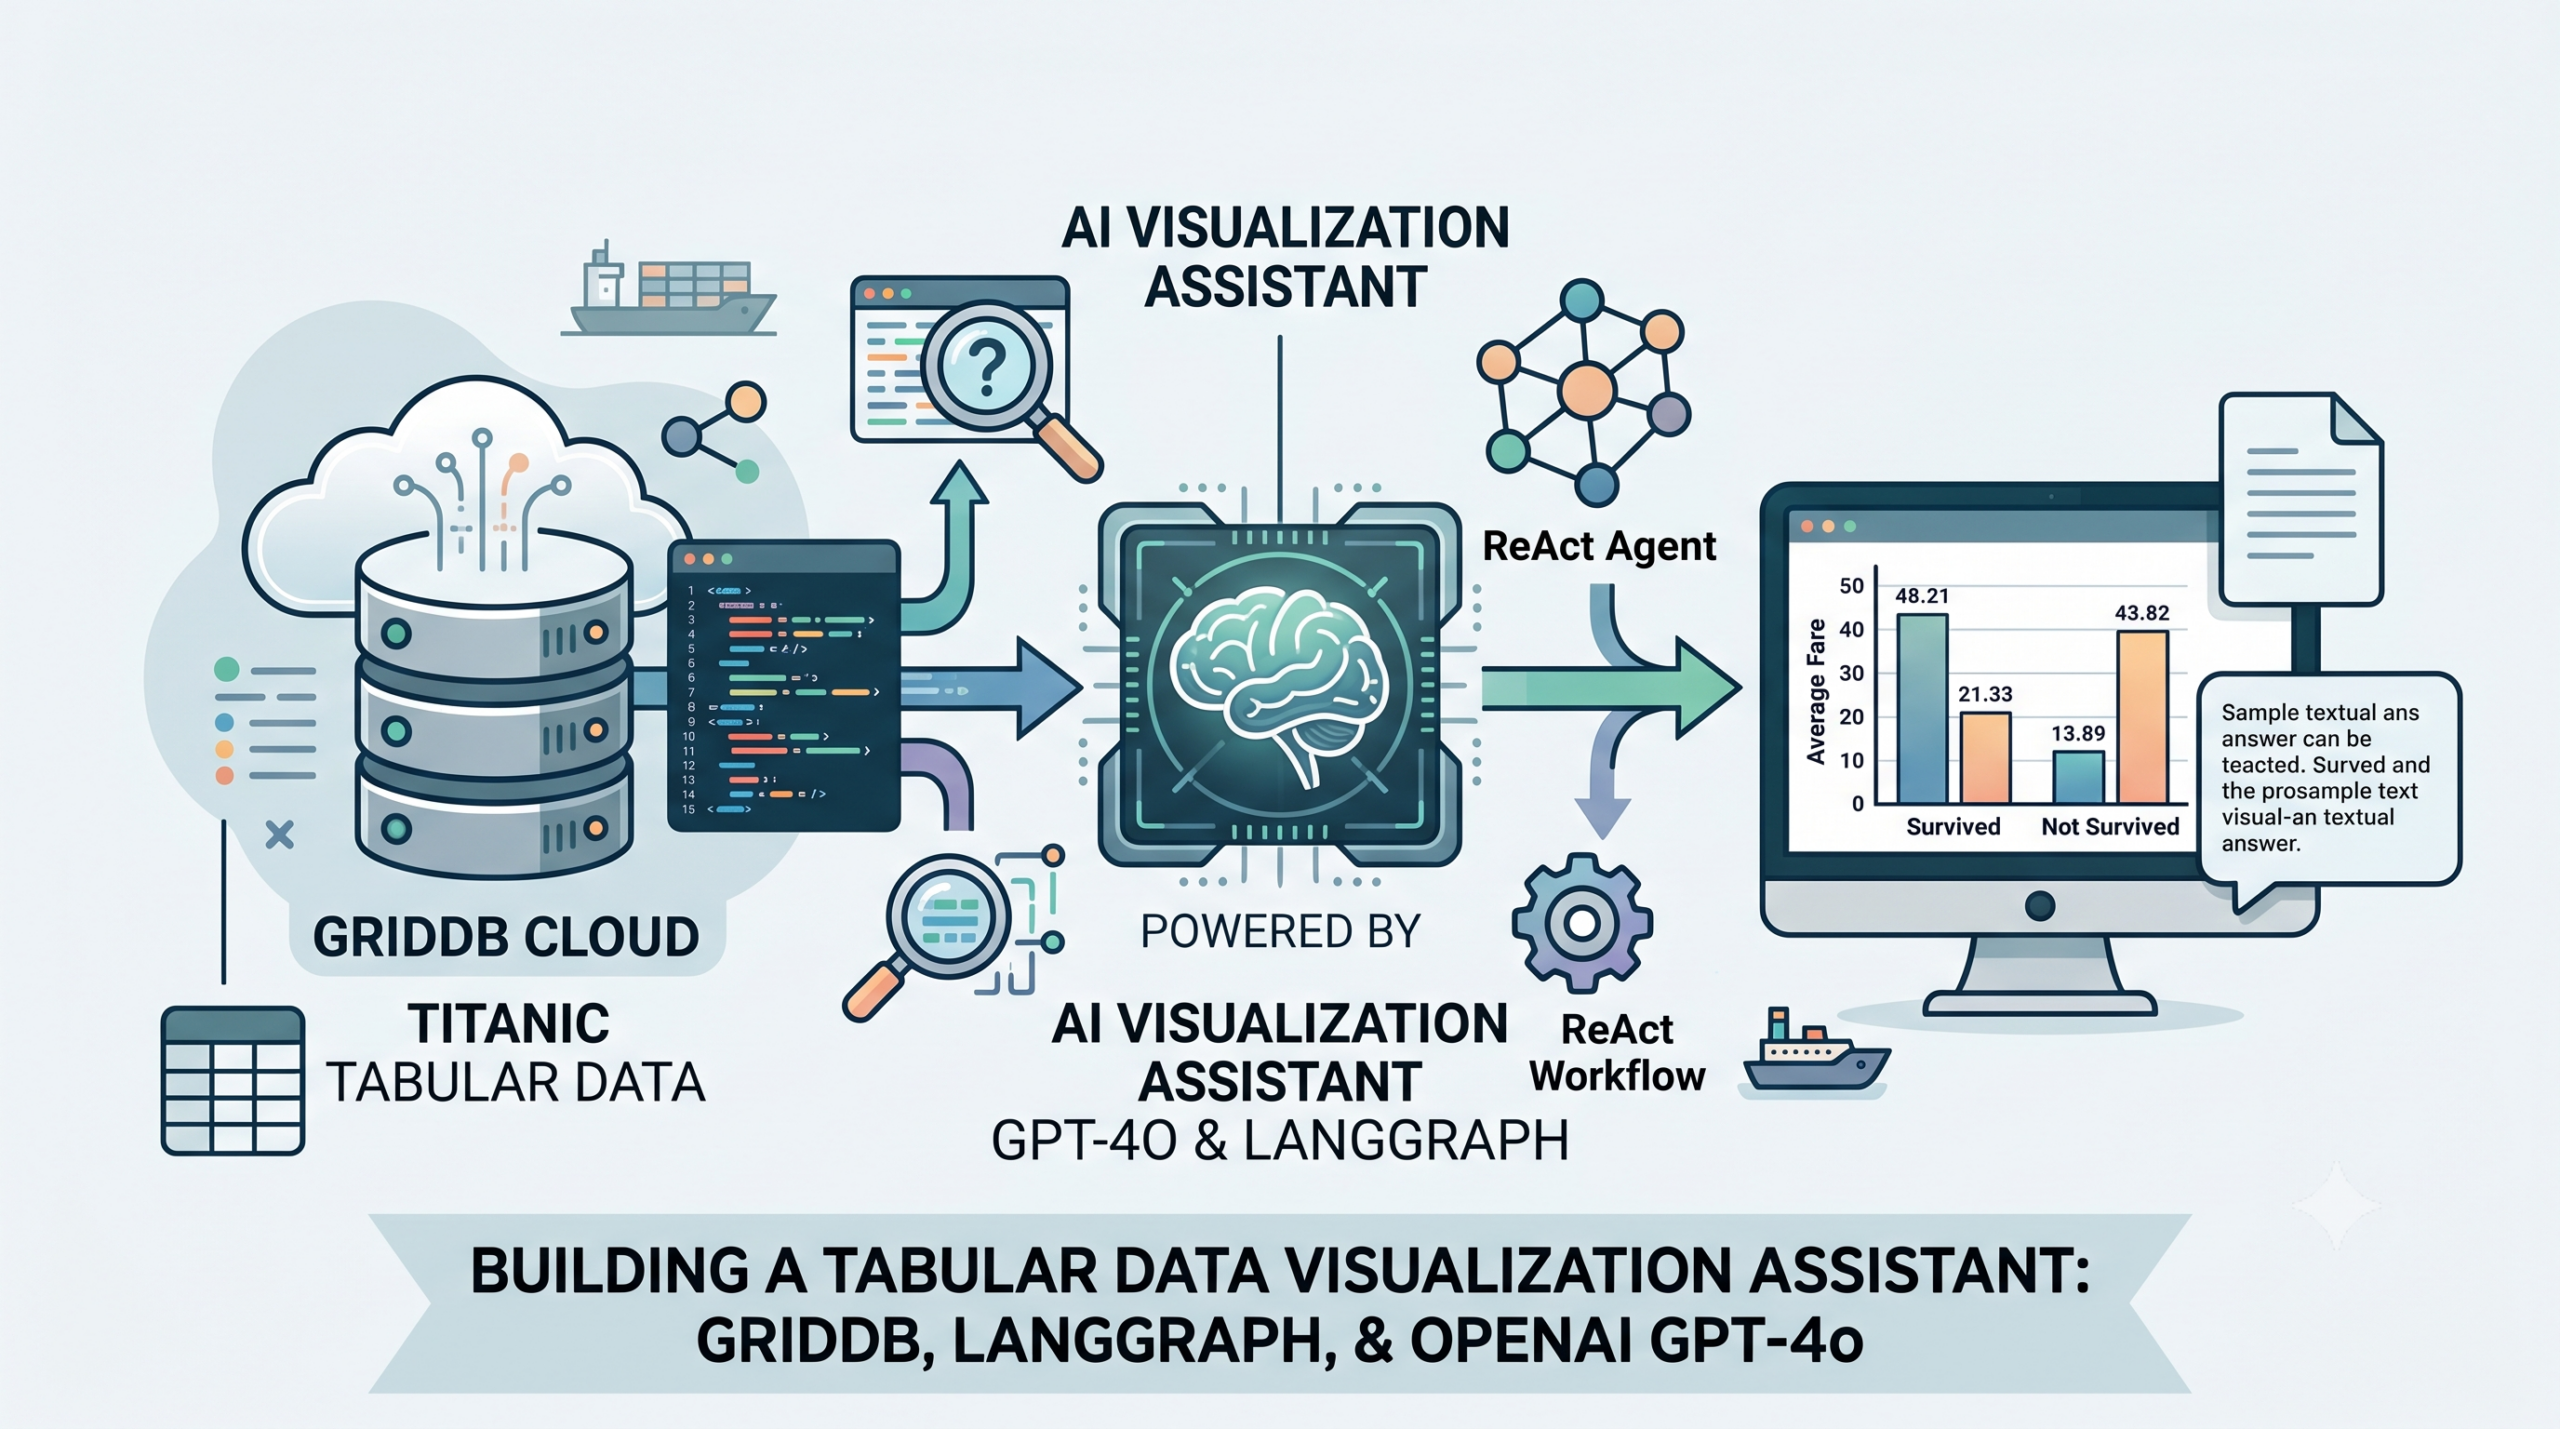
Large Language Models (LLMs) allow developers to combine advanced AI reasoning with powerful databases to analyze and visualize complex datasets.
In this article, you will see how to build a tabular data visualization assistant using GridDB Cloud, LangGraph, and the OpenAI GPT-4o model. We will import the Titanic dataset into GridDB, query it programmatically, and then use a LangGraph ReAct agent to answer questions and generate plots automatically.
GridDB’s flexible schema, high-performance design, and compatibility with structured data make it well-suited for storing both tabular and time series data.
Prerequisites:
You will need the following to run scripts in this article:
- A GridDB cloud account. Sign up for GridDB cloud and complete configuration settings.
- OpenAI API Key. You can use any other LLM provider, but you will need to update the scripts in this article slightly.
Installing and Importing Required Libraries
The following script installs and imports the required libraries for this application:
!pip install langchain
!pip install langchain-core
!pip install langchain-community
!pip install langgraph
!pip install langchain_huggingface
!pip install tabulate
!pip uninstall -y pydantic
!pip install --no-cache-dir "pydantic>=2.11,<3"
import pandas as pd
import json
import datetime as dt
import base64
import requests
import numpy as np
from pathlib import Path
import matplotlib
matplotlib.use("Agg") # safe, consistent backend
import matplotlib.pyplot as plt
from typing_extensions import Annotated
from operator import add # used as list reducer
from typing import TypedDict, List, Dict
from pydantic import BaseModel, Field
from IPython.display import Image, display
from langchain_core.prompts import ChatPromptTemplate
from langchain_core.tools import tool
from langchain_openai import ChatOpenAI, OpenAI
from langgraph.graph import START, END, StateGraph
from langchain_core.messages import HumanMessage
from langchain_experimental.agents import create_pandas_dataframe_agent
from langgraph.prebuilt import create_react_agent
from langchain.agents.agent_types import AgentTypeImporting the Dataset
We will insert the Titanic dataset into GridDB and create visualizations using this data. The following script imports the data into a Pandas dataframe.
dataset = pd.read_csv("https://raw.githubusercontent.com/datasciencedojo/datasets/refs/heads/master/titanic.csv",
                      encoding = 'utf-8')
dataset.head()
Output:

Establishing a Connection with GridDB Cloud
To establish a connection with GridDB, replace your credentials in the following script and run it.
username = "USER_NAME"
password = "PASSWORD"
base_url = "GRIDDB_CLOUD_URL"

url = f"{base_url}/checkConnection"

credentials = f"{username}:{password}"
encoded_credentials = base64.b64encode(credentials.encode()).decode()

headers = {
    'Content-Type': 'application/json',  # Added this header to specify JSON content
    'Authorization': f'Basic {encoded_credentials}',
    'User-Agent': 'PostmanRuntime/7.29.0'
}

response = requests.get(url, headers=headers)

print(response.status_code)
print(response.text)
Output:
200If you see the above message, you have successfully connected with GridDB cloud.
Inserting Data in GridDB Cloud Dataset
To insert data in GridDB, you first need to map your dataset types to GridDB dataset types and then create a GridDB container.
Creating a Container for the Titanic Dataset in GridDB
The following script maps your dataset column types to GridDB column types.
dataset.insert(0, "SerialNo", dataset.index + 1)
dataset.columns.name = None
# Mapping pandas dtypes to GridDB types
type_mapping = {
    "int64":          "LONG",
    "float64":        "DOUBLE",
    "bool":           "BOOL",
    'datetime64': "TIMESTAMP",
    "object":         "STRING",
    "category":       "STRING",
}

# Generate the columns part of the payload dynamically
columns = []
for col, dtype in dataset.dtypes.items():
    griddb_type = type_mapping.get(str(dtype), "STRING")  # Default to STRING if unknown
    columns.append({
        "name": col,
        "type": griddb_type
    })

print(columns)
[{'name': 'SerialNo', 'type': 'LONG'},
{'name': 'PassengerId', 'type': 'LONG'},
{'name': 'Survived', 'type': 'LONG'},
{'name': 'Pclass', 'type': 'LONG'},
{'name': 'Name', 'type': 'STRING'},
{'name': 'Sex', 'type': 'STRING'},
{'name': 'Age', 'type': 'DOUBLE'},
{'name': 'SibSp', 'type': 'LONG'},
{'name': 'Parch', 'type': 'LONG'},
{'name': 'Ticket', 'type': 'STRING'},
{'name': 'Fare', 'type': 'DOUBLE'},
{'name': 'Cabin', 'type': 'STRING'},
{'name': 'Embarked', 'type': 'STRING'}]
Next, we will create a collection type container titanic_db in our GridDB cloud database.
url = f"{base_url}/containers"
container_name = "titanic_db"
# Create the payload for the POST request
payload = json.dumps({
    "container_name": container_name,
    "container_type": "COLLECTION",
    "rowkey": True,  # Assuming the first column as rowkey
    "columns": columns
})


# Make the POST request to create the container
response = requests.post(url, headers=headers, data=payload)

# Print the response
print(f"Status Code: {response.status_code}")
Output:
Status Code: 201Inserting Titanic Dataset in GridDB
Next, we will iterate through the rows in our dataset, create a JSON payload containing the data, and will insert the data into the container we created in the previous section.
url = f"{base_url}/containers/{container_name}/rows"
# Convert dataset to list of lists (row-wise) with proper formatting

def format_row(row):
    formatted = []
    for item in row:
        if pd.isna(item):
            formatted.append(None)  # Convert NaN to None
        elif isinstance(item, bool):
            formatted.append(str(item).lower())  # Convert True/False to true/false
        elif isinstance(item, (int, float)):
            formatted.append(item)  # Keep integers and floats as they are
        else:
            formatted.append(str(item))  # Convert other types to string
    return formatted

# Prepare rows with correct formatting
rows = [format_row(row) for row in dataset.values.tolist()]

# Create payload as a JSON string
payload = json.dumps(rows)

# Make the PUT request to add the rows to the container
response = requests.put(url, headers=headers, data=payload)

# Print the response
print(f"Status Code: {response.status_code}")
print(f"Response Text: {response.text}")
Output:
Status Code: 200
Response Text: {"count":891}
The above output shows that the data has been successfully inserted into GridDB.
Next, we will see how to retrieve data from GridDB and plot visualizations using it.
Visualizing GridDB Results Using OpenAI and ReAct Agent
The following script reads data from GridDB and inserts it in a Pandas dataframe.
container_name = "titanic_db"

url = f"{base_url}/containers/{container_name}/rows"

# Define the payload for the query
payload = json.dumps({
    "offset": 0,           # Start from the first row
    "limit": 10000,         # Limit the number of rows returned
    "condition": "",       # No filtering condition (you can customize it)
    "sort": ""             # No sorting (you can customize it)
})

# Make the POST request to read data from the container
response = requests.post(url, headers=headers, data=payload)

# Check response status and print output
print(f"Status Code: {response.status_code}")
if response.status_code == 200:
    try:
        data = response.json()
        print("Data retrieved successfully!")

        # Convert the response to a DataFrame
        rows = data.get("rows", [])
        titanic_dataset = pd.DataFrame(rows, columns=[col for col in dataset.columns])

    except json.JSONDecodeError:
        print("Error: Failed to decode JSON response.")
else:
    print(f"Error: Failed to query data from the container. Response: {response.text}")

print(titanic_dataset.shape)
titanic_dataset.head()
Output:
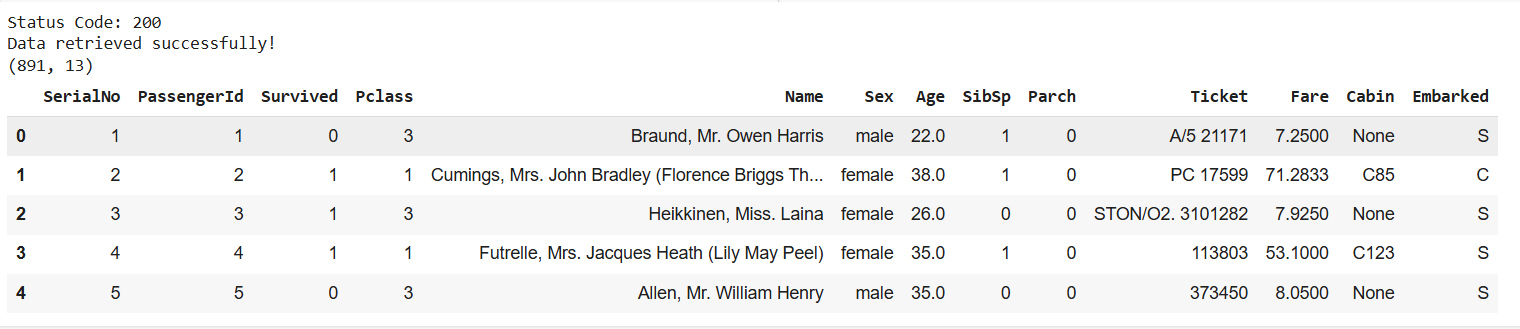
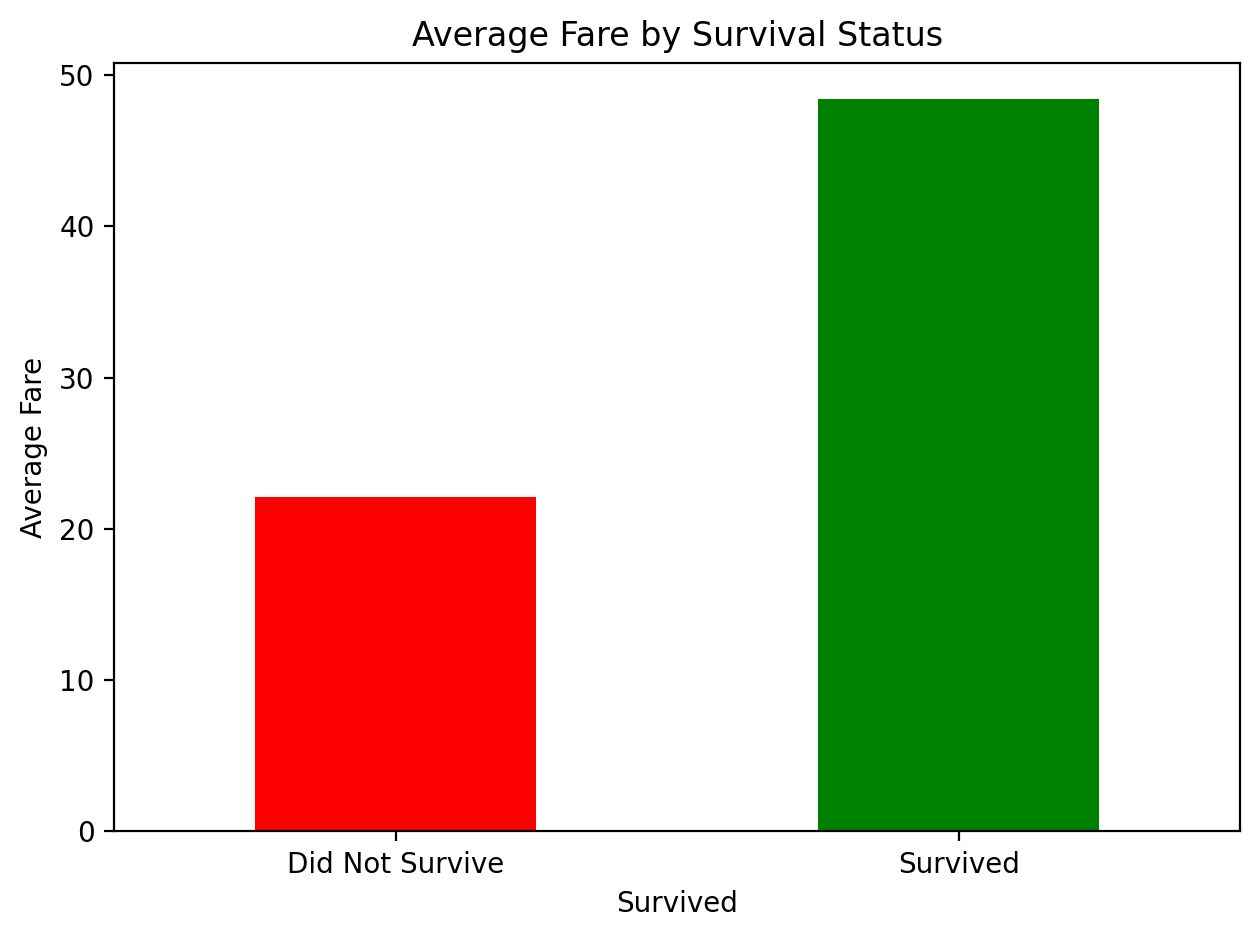
Let’s try to plot the average for the passengers who survived and those who didn’t. We will use these values to verify the result from our ReAct agent.
avg = titanic_dataset.groupby('Survived')['Fare'].mean().round(2)
print(avg)
Output:
Survived
0    22.12
1    48.40
Name: Fare, dtype: float64
Creating a LangGraph ReAct Agent for Data Visualization
To plot visualizations, we will create a LangGraph ReAct agent with two tools: df_answer and save_plot.
The df_answer tool will use the create_pandas_dataframe_agent to retrieve information from the database, including the plot, if any. The save_plot tool saves the plot to the local drive.
The following script defines the agent’s state and the large language model (OpenAI GPT-4o in this case) we will use to answer the user’s question.
class State(TypedDict):
    question: str
    answer: str
    plots: Annotated[List[Dict[str, str]], add]


api_key = "YOUR_OPENAI_API_KEY"

llm = ChatOpenAI(model="gpt-4o",
                 api_key=api_key,
                temperature = 0)
Next, we define the create_pandas_dataframe_agent function that returns information from the Pandas dataframe retrieved from GridDB.
We also define the df_answer tool that calls the create_pandas_dataframe_agent.
df_agent = create_pandas_dataframe_agent(llm,
                                     titanic_dataset,
                                     verbose=True,
                                     agent_type=AgentType.ZERO_SHOT_REACT_DESCRIPTION,
                                     allow_dangerous_code=True)


_LAST = {"fig": None}                # keep a handle to the last real figure

@tool("df_answer")
def df_answer(question: str) -> str:
   """
   Use the pandas DataFrame agent to compute/plot.
   IMPORTANT: do NOT call plt.show() or plt.close() in the generated code.
   """
   res = df_agent.invoke(
       question
   )

   # CAPTURE whichever figure the agent actually created
   fig_nums = plt.get_fignums()          # existing figures in this process
   if fig_nums:
       _LAST["fig"] = plt.figure(fig_nums[-1])   # latest real figure
   return res["output"]
The following script defines the save_plot tool that saves the plot generated by the df_answer tool.
@tool("save_plot")
def save_plot(filename: str = "plot.png", dpi: int = 200, close: bool = True) -> str:
    """
    Save the most recent existing Matplotlib figure (not an empty gcf()).
    Returns {"plot": {"name": ..., "path": ...}} or {"error": ...}.
    """
    Path("plots").mkdir(exist_ok=True)
    fig = _LAST.get("fig")

    # Fallback: grab last live figure if we didn't capture yet
    if fig is None:
        nums = plt.get_fignums()
        if not nums:
            return json.dumps({"error": "no_figure", "message": "No active figure to save."})
        fig = plt.figure(nums[-1])

    # Render + save
    fig.tight_layout()
    try:
        fig.canvas.draw()                # ensure render
    except Exception:
        pass

    out = Path("plots") / filename
    fig.savefig(out, dpi=dpi, bbox_inches="tight")

    if close:
        plt.close(fig)                   # avoid accumulating figures

    return json.dumps({"plot": {"name": filename, "path": str(out.resolve())}})
Finally we define the ReAct agent using the LLM and the tool we just defined.
SYSTEM = """
You work over a Titanic pandas DataFrame.
- To compute answers or create charts, call `df_answer(question=...)`.
- If a plot should be saved, call `save_plot(filename=..., dpi=200)`.
- Keep text concise. If you saved a plot, you may echo the absolute path.
"""

react = create_react_agent(
    llm,
    tools=[df_answer, save_plot],
    prompt=SYSTEM,
)
The following script creates our final graph object.
def run_react(state: State) -> State:
    out = react.invoke({"messages": [("user", state["question"])]})

    msgs = out["messages"]
    final_text = msgs[-1].content

    new_plots = []
    for m in msgs:
        # Tool messages include the tool's return in `content`
        try:
            data = json.loads(getattr(m, "content", "") or "{}")
        except Exception:
            data = None
        if isinstance(data, dict) and "plot" in data:
            new_plots.append(data["plot"])  # {"name": "...", "path": "..."}

    return {"answer": final_text, "plots": new_plots}

graph_builder = StateGraph(State)
graph_builder.add_node("ask_question", run_react)
graph_builder.add_edge(START, "ask_question")
graph_builder.add_edge("ask_question", END)
graph = graph_builder.compile()
display(Image(graph.get_graph(xray=True).draw_mermaid_png()))
Output:
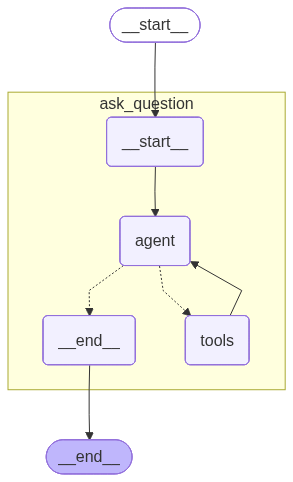
The above output shows the flow of the graph. The user’s question is passed to the ReAct agent, which decides which tools it requires to answer the user’s query.
Testing the Agent & Generating Responses
Let’s test the agent. We will first ask a simple question that doesn’t require saving or plotting a graph.
# A) plain Q&A
s = graph.invoke({"question": "What is the average Fare for passengers that survive and those who did not?"})
print(f"\nFinal Answer: {s['answer']}")
Output:
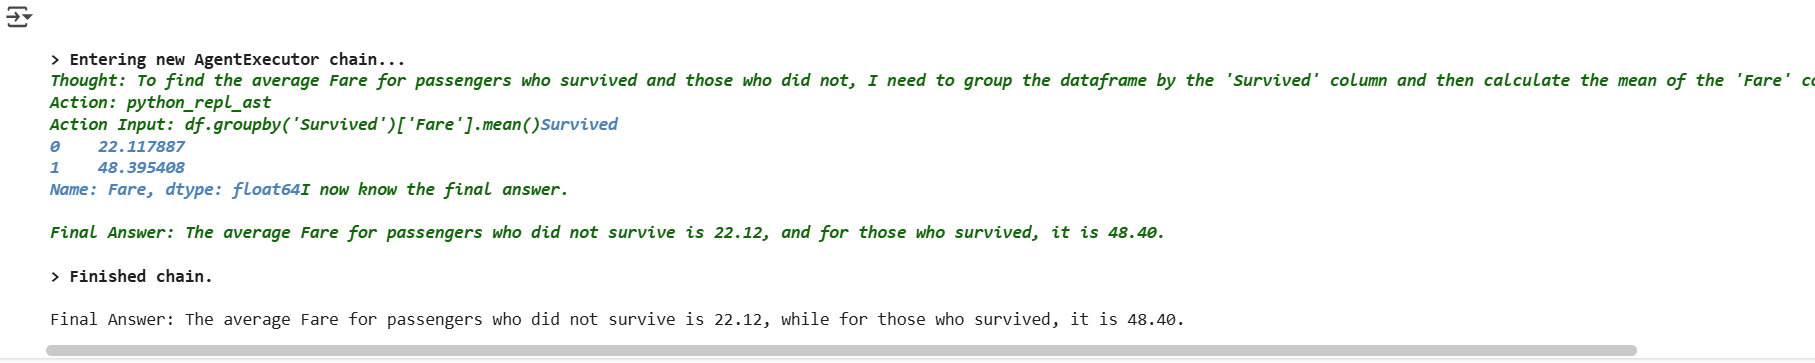
The output displays the average fares for passengers who survived and those who did not. Note that these values are identical to the ones we retrieved earlier by executing a direct operation on the Pandas dataframe.
Next, we will request our agent to plot a chart using the results.
# B) plot + save (the agent will call save_plot internally)
s = graph.invoke({
    "question": ("Plot a bar chart of average Fare for passengers that survive and those who did not?"),
})
print(f"\nFinal Answer: {s['answer']}")
print("plots so far:", s["plots"])
Output:
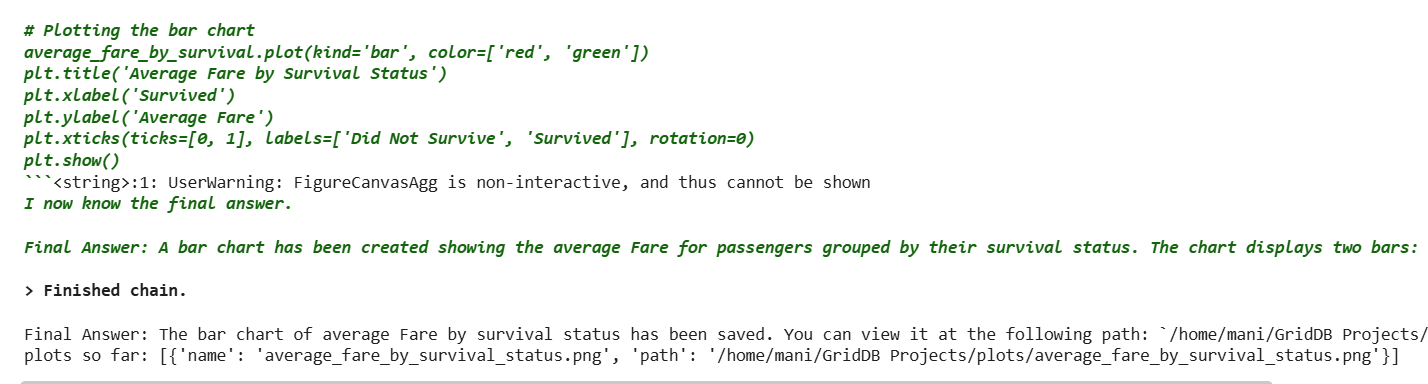
The output shows that the agent saved the plot and also returned its location in the output.
If you open the plot, you can see the average fare by survival rate plotted in the form of a bar chart.
Conclusion
This article demonstrates how to integrate GridDB Cloud with LangGraph and OpenAI to create a ReAct agent that can query tabular datasets and generate visualizations. By combining structured storage with the reasoning power of LLMs, we developed a system that seamlessly handles both textual answers and graphical plots.
If you have questions or need support with GridDB Cloud, feel free to post them on Stack Overflow using the griddb tag. The GridDB team will be happy to help.
For the complete code and additional examples, visit GridDB Blogs GitHub repository.