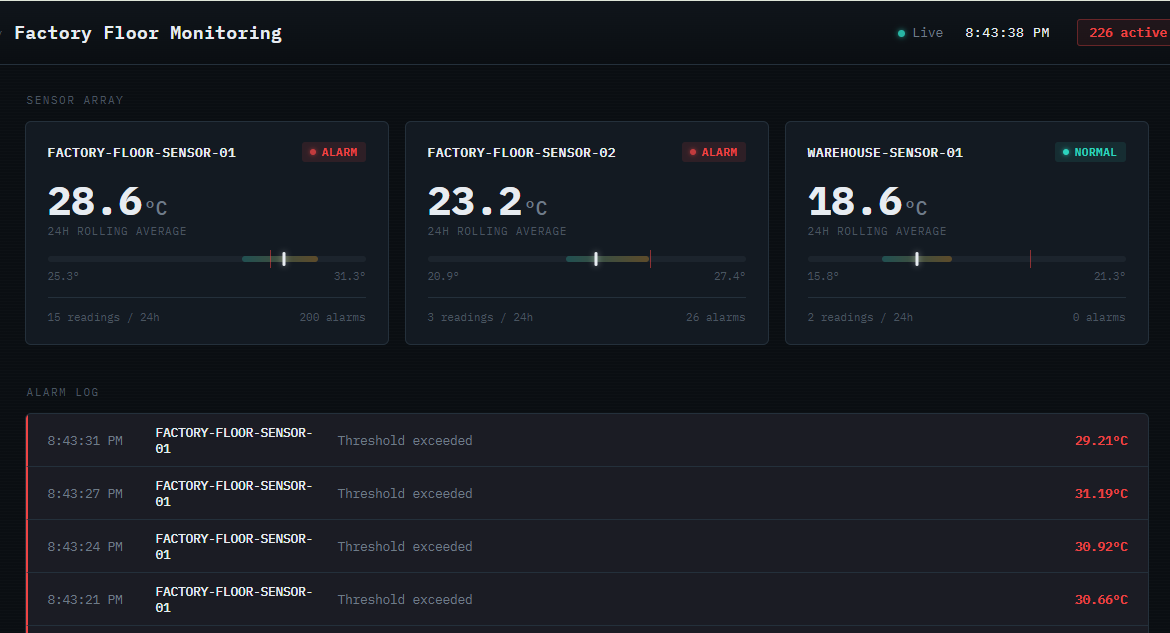
Modern factory floors continuously generate streams of sensor data, including temperature, humidity, vibration and how much they are producing. On their own, each reading might not seem important. When you collect this data from many machines over a long time it is the best way for a factory to find problems early and avoid shutting down for a long time.
The main challenge is that this data is time-series: it is timestamped, arrives quickly, and is usually written once. Using a general-purpose relational table can work when there is not much data, but as you add more sensors and keep data longer, problems appear. Indexes get too large, range queries slow down, and deleting old data becomes difficult.
This post walks through a complete solution: a Java application that simulates readings from three factory sensors, stores them in GridDB‘s native TimeSeries containers, and serves a live web dashboard that displays rolling averages and threshold alerts in real time.
GridDB is an open-source distributed NoSQL database purpose-built for IoT and time-series workloads. Its TimeSeries containers are optimized for exactly the shape of problem a sensor fleet like this one produces: high write throughput paired with efficient temporal queries.
—
What you’ll learn
By the end of this tutorial, you’ll be able to:
- Set up a complete GridDB + Java environment using Docker Compose, with no local installation required
- Ingest time-series sensor data using GridDB’s
TimeSeriescontainers and theappend()method - Query and analyze data with built-in aggregations (
AVG,MIN,MAX) and TQL, GridDB’s SQL-like query language - Visualize live data with a dashboard featuring sparklines, range gauges, and an alert log
- Deploy a pipeline that works on Windows, Mac, and Linux without host-networking issues
—
Prerequisites
- Docker and Docker Compose (Docker Desktop, with the WSL2 backend enabled if you’re on Windows)
- Java 17 and Maven — only needed if you want to build or modify the Java app outside of Docker; the provided
Dockerfilehandles both automatically if you’re just running the demo - Git, to clone the project repository
- No local GridDB installation is required — it runs entirely inside the Docker Compose stack
—
Project structure
griddb-dashboard-demo/
├── docker-compose.yml
└── app/
    ├── Dockerfile
    ├── pom.xml
    └── src/main/
        ├── java/com/example/griddb/
        │   ├── Main.java
        │   ├── GridDbConnection.java
        │   ├── SensorReading.java
        │   ├── SensorIngestor.java
        │   └── DashboardServer.java
        └── resources/
            └── dashboard.html
docker-compose.yml at the root wires the GridDB server and the Java app together on a shared Docker network. Everything under app/ is the Java side: the Dockerfile builds it, pom.xml declares the GridDB client dependency, and dashboard.html is the front end served directly by the Java app’s embedded HTTP server.
—
Why a time-series database here
GridDB is built around two container types: Collection, for general keyed data, and TimeSeries, which uses the row’s timestamp as its key and is optimized for exactly this append-heavy, time-ordered access pattern. For a monitoring use case, that means two things fall out almost for free:
- Efficient aggregation over time windows. Asking “what was the average temperature for sensor 3 over the last 24 hours” is a single built-in aggregation call, not a hand-rolled
GROUP BYover a timestamp column. - Natural isolation per device. Each sensor gets its own
TimeSeriescontainer, so a burst of writes from one noisy machine doesn’t contend with reads against another.
It is worth comparing this approach with a traditional relational database design. A common starting point for many IoT projects is to store all sensor readings in a single relational table containing columns such as device_id, timestamp, and the measured values, with indexes added to support time-range queries. While this approach works well for small-scale deployments, it becomes increasingly difficult to maintain as the number of devices, data ingestion rate, and retention period grow.
As sensor data grows, traditional relational databases become increasingly difficult to manage. Every new reading requires index updates, time-range queries must search ever-larger tables, and removing historical data often requires costly delete operations or custom partitioning strategies.
GridDB is designed to address these challenges. Its native TimeSeries containers optimize sequential writes and time-based queries, while built-in row expiration automatically removes outdated data based on configurable retention policies. This reduces database maintenance and simplifies application development, making GridDB well suited for large-scale Industrial IoT and real-time monitoring applications.
GridDB Compared with PostgreSQL and InfluxDB
| Feature | GridDB | PostgreSQL | InfluxDB |
|---|---|---|---|
| Native Time-Series Support | Yes | Partial (via extensions such as TimescaleDB) | Yes |
| Horizontal Scaling | Yes | Primarily vertical (distributed extensions available) | Yes |
| Query Language | TQL (SQL-like) | SQL | InfluxQL / Flux |
| Designed for Time-Series & IoT | Yes | General-purpose database | Yes |
| ACID Transactions | Yes | Yes | Limited* |
| Official Java Support | Official Java Client | JDBC | Official Java Client |
| Docker Support | Yes | Yes | Yes |
> \* InfluxDB provides durability and consistency for time-series workloads but does not implement full ACID transactional semantics across multiple records in the same way as traditional relational databases such as PostgreSQL.
—
Architecture
The system has four main components:
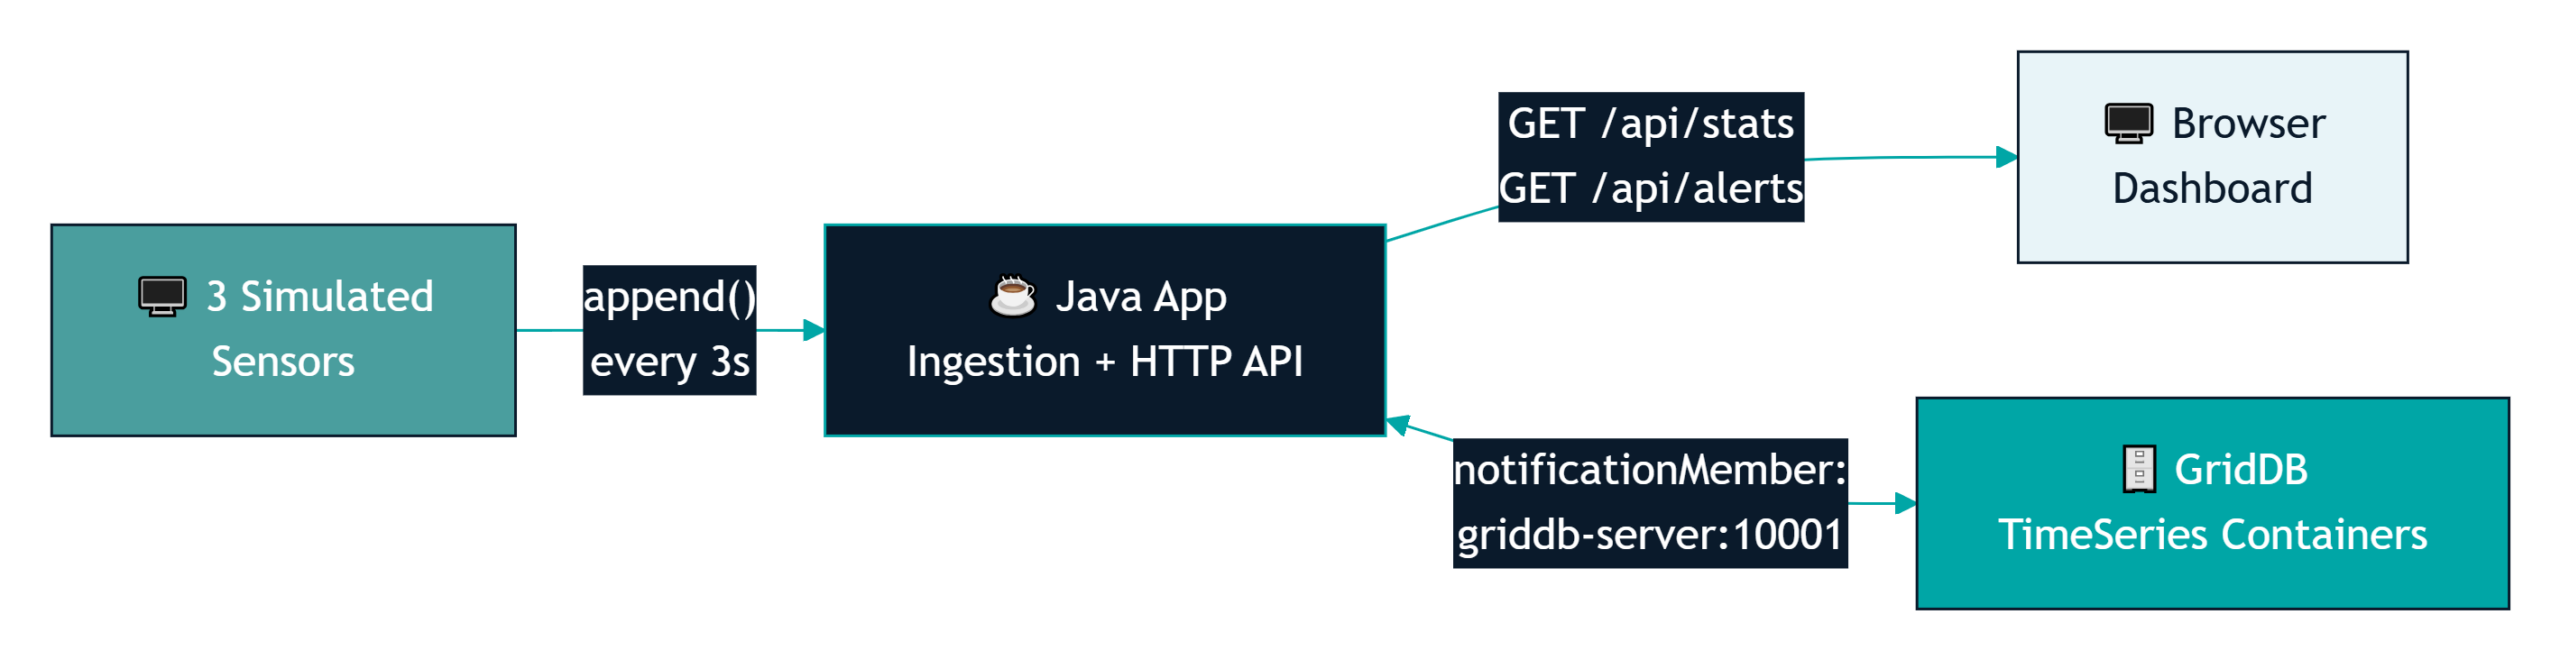
- GridDB server — running in Docker, one container from the standard GridDB image.
- A Java ingestion process — seeds historical data, then keeps appending a new reading every few seconds per simulated device.
- An embedded HTTP API — built on the JDK’s built-in
com.sun.net.httpserver, so there’s no extra web framework to configure. It exposes/api/stats,/api/alerts, and/api/history. - A dashboard page — polls those endpoints and renders a fleet summary strip, per-device panels with live sparkline trend lines and range gauges, and an alarm log.
Everything ships in one docker-compose.yml, so docker compose up --build gets a full GridDB cluster and the Java app talking to each other on a bridge network.
The complete source — the Dockerfile, docker-compose.yml, and all Java classes — is on GitHub: dagmawit-sudo-cloud/griddb-dashboard-demo.
Clone it now to follow along and run each step as you read.
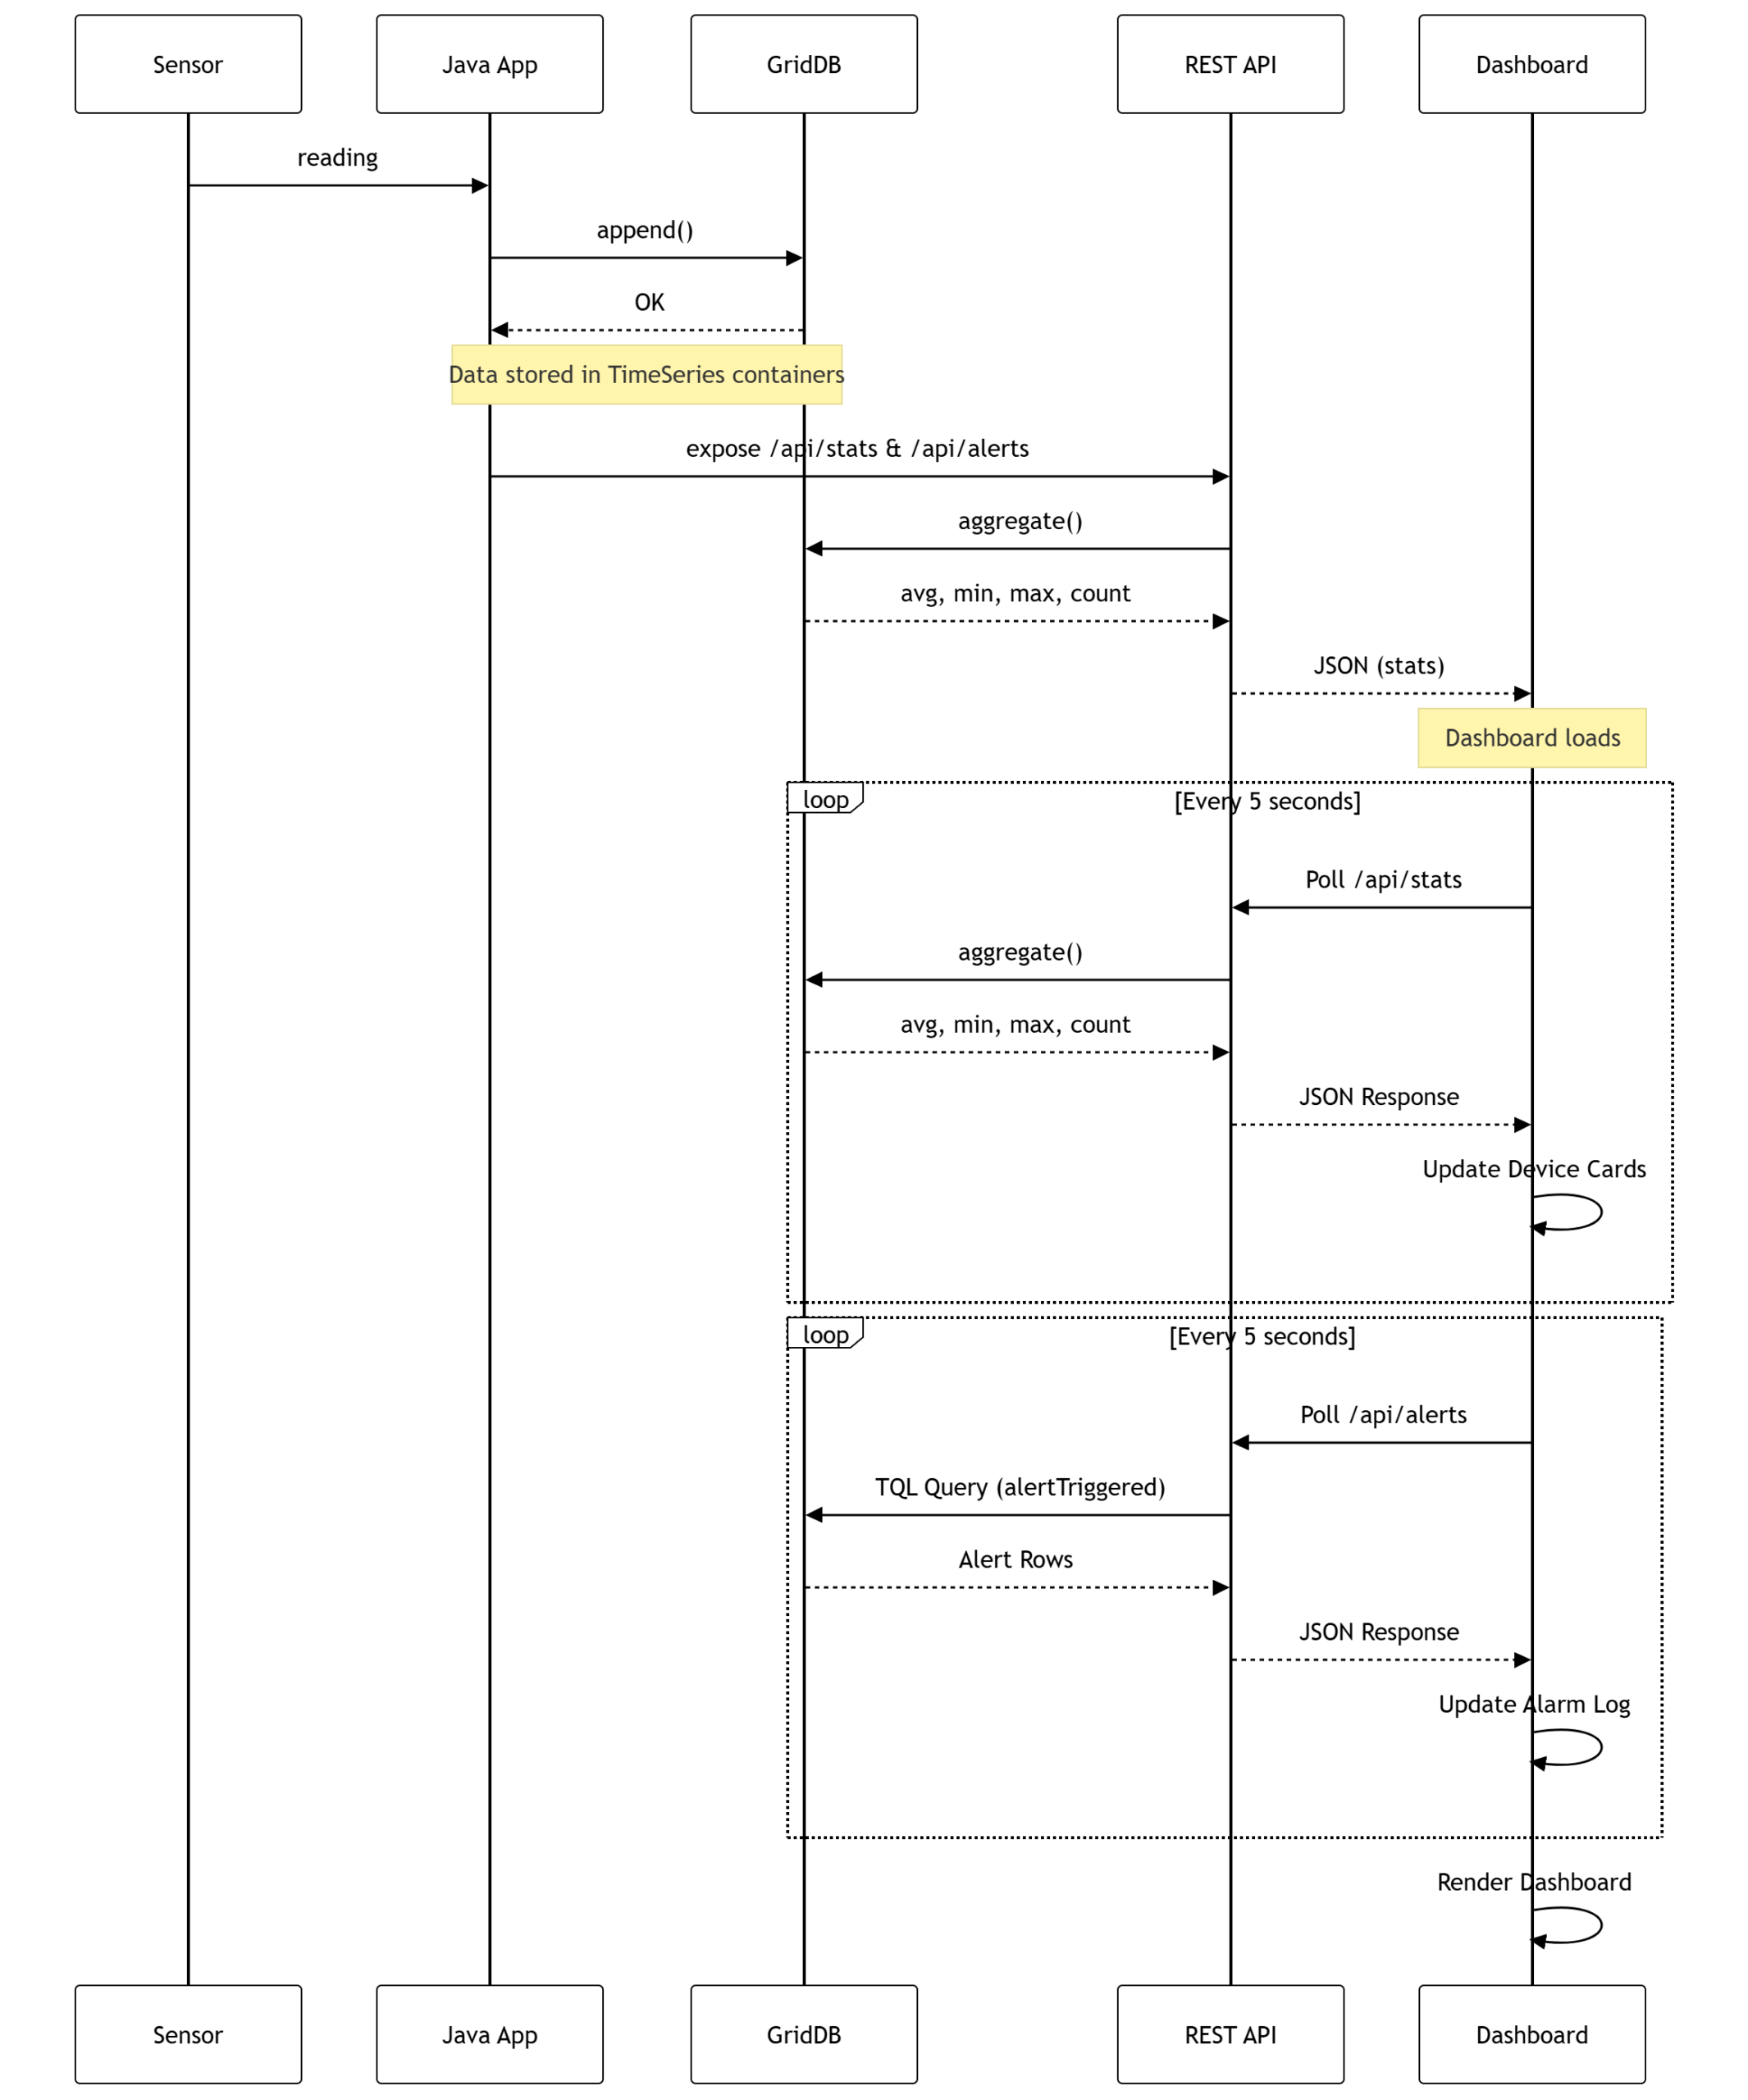
Data flow, end to end
—
Why Docker
Docker packages both GridDB and the Java application into isolated containers, so the exact same setup runs the same way regardless of whether it’s on your laptop, a teammate’s machine, or a CI pipeline — no “works on my machine” gap between installing GridDB natively and getting the Java client to find it.
It also sidesteps a real platform-specific headache: Docker Desktop on Windows and Mac doesn’t support host networking the way Linux does, so a Compose setup using a proper bridge network (as this one does) is the version that actually works cross-platform, rather than one that only works if you happen to be on Linux.
—
Modeling a sensor reading
The Java side talks to GridDB through its official Java Client API — the same supported gridstore library GridDB documents for production use, not a community wrapper or a raw protocol implementation. Every device writes rows shaped like this:
public class SensorReading {
    @RowKey Date timestamp;
    String deviceId;
    double temperature;
    double humidity;
    boolean alertTriggered;
}
The @RowKey annotation on timestamp is what tells GridDB this class belongs in a TimeSeries container rather than a plain Collection. alertTriggered is computed at write time rather than derived later — efficient to compute once, and it lets the alerts endpoint run a simple boolean filter instead of recomputing a threshold check on every poll.
Connecting, with retry
Docker Compose starts containers in parallel, so the Java app frequently comes up before GridDB is actually ready to accept connections. The connection helper handles that with a bounded retry loop instead of failing hard on the first attempt:
Properties props = new Properties();
props.setProperty("notificationMember", notificationMember);
props.setProperty("clusterName", clusterName);
props.setProperty("user", user);
props.setProperty("password", password);

for (int attempt = 1; attempt <= maxAttempts; attempt++) {
    try {
        GridStore store = GridStoreFactory.getInstance().getGridStore(props);
        System.out.println("Connected to GridDB at " + notificationMember);
        return store;
    } catch (GSException e) {
        System.out.println("Attempt " + attempt + "/" + maxAttempts +
                ": GridDB not ready yet (" + e.getMessage() + "), retrying in 5s...");
        Thread.sleep(5000);
    }
}
All four connection properties — notification member, cluster name, user, password — are read from environment variables set in docker-compose.yml, which keeps the same image usable across dev and staging without a rebuild.
> Tip: GridDB’s cluster takes 30–60 seconds to form after container startup. The retry loop ensures your application connects reliably even if it starts before the database is ready.
Packaging the Java app
The Java side builds as a two-stage Docker image, so the final container doesn’t carry a Maven install around at runtime:
FROM maven:3.9-eclipse-temurin-17 AS build
WORKDIR /build
COPY pom.xml .
COPY src ./src
RUN mvn -q clean package -DskipTests

FROM eclipse-temurin:17-jre
WORKDIR /app
COPY --from=build /build/target/app.jar app.jar
EXPOSE 8080
CMD ["java", "-jar", "app.jar"]
The build stage compiles the fat jar with Maven; the runtime stage starts from a bare JRE image and copies only the finished artifact across. The net effect is a noticeably smaller image and a faster docker compose up on the second run, since Docker’s layer cache skips the Maven download step entirely as long as pom.xml hasn’t changed.
docker-compose.yml wires this image up to the GridDB container on a dedicated bridge network and passes in the connection properties as environment variables, so the two containers can find each other by service name (griddb-server:10001) without any manual network configuration.
—
Generating and appending data
The application supports two ingestion workflows: an initial historical data load to populate the dashboard and a continuous streaming process that appends new sensor readings as they are generated.
public static void ingest(GridStore store, String deviceId, int readingCount, double baseTemp) throws GSException {
    TimeSeries<SensorReading> ts = store.putTimeSeries(deviceId, SensorReading.class);
    for (int i = 0; i < readingCount; i++) {
        ts.append(buildReading(deviceId, baseTemp, new Random()));
    }
}
append() is the right call for time-series writes specifically — it assumes rows arrive in increasing timestamp order and skips the row-key lookup a generic put() would do, which matters once you’re writing thousands of readings a minute across many devices. The continuous variant runs the same append() call on a daemon thread every three seconds per device.
—
Querying: aggregates and alerts
The stats endpoint leans on GridDB’s built-in aggregation functions rather than pulling raw rows into Java and averaging them by hand:
Date now = TimestampUtils.current();
Date oneDayAgo = TimestampUtils.add(now, -24, TimeUnit.HOUR);

double avg = ts.aggregate(oneDayAgo, now, "temperature", Aggregation.AVERAGE).getDouble();
double min = ts.aggregate(oneDayAgo, now, "temperature", Aggregation.MINIMUM).getDouble();
double max = ts.aggregate(oneDayAgo, now, "temperature", Aggregation.MAXIMUM).getDouble();
The alerts endpoint uses GridDB’s TQL query language instead, since it’s a row filter rather than an aggregate:
Query<SensorReading> query = ts.query("WHERE alertTriggered", SensorReading.class);
RowSet<SensorReading> rows = query.fetch();
> TQL pitfall: For boolean fields, TQL allows conditions to be written directly as WHERE alertTriggered, which is the form used throughout this example.
Both endpoints return hand-built JSON strings over the JDK’s embedded HttpServer. That’s a deliberate simplification for a demo of this size — swap in your JSON library and framework of choice once the endpoint list grows past two.
API endpoints
| Method & route | Purpose |
|---|---|
GET /api/health |
Basic liveness check |
GET /api/stats |
Per-device avg/min/max/reading count over the configured window |
GET /api/alerts |
The most recent threshold-breaching readings across all devices |
GET /api/history?device= |
The last 40 readings for one device, oldest first — powers the sparkline trend line |
GET / |
The dashboard HTML page itself |
—
The dashboard
The dashboard is implemented as a lightweight, static HTML page served directly by the Java application’s embedded HTTP server. The interface is designed to resemble an industrial control-room dashboard, providing operators with a clear, real-time view of factory conditions.
Every five seconds, the dashboard requests the latest data from the REST API and updates the display with three key monitoring components:
- A fleet summary displays an overview of the monitored environment, including the number of active devices, the fleet-wide average temperature, and the current number of active alerts.
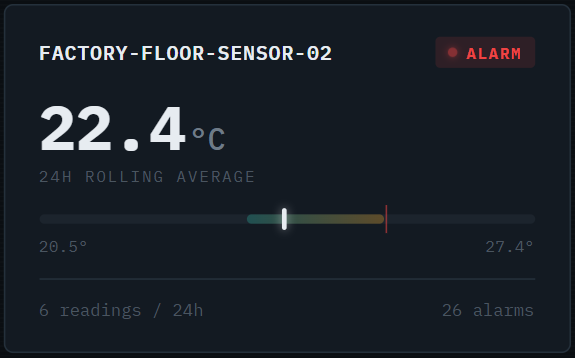
- Device Monitoring panels present a dedicated panel for each sensor, featuring a status indicator, the latest sensor reading, a sparkline showing recent temperature trends, and a min/max range gauge with a configurable alert threshold.
- An alarm log displays the most recent threshold breaches and presents a clear empty state when no alerts have been triggered.
That five-second polling interval is a knob worth tuning in your own setup tighter for a control-room display, looser if you’re polling over a slow network link.
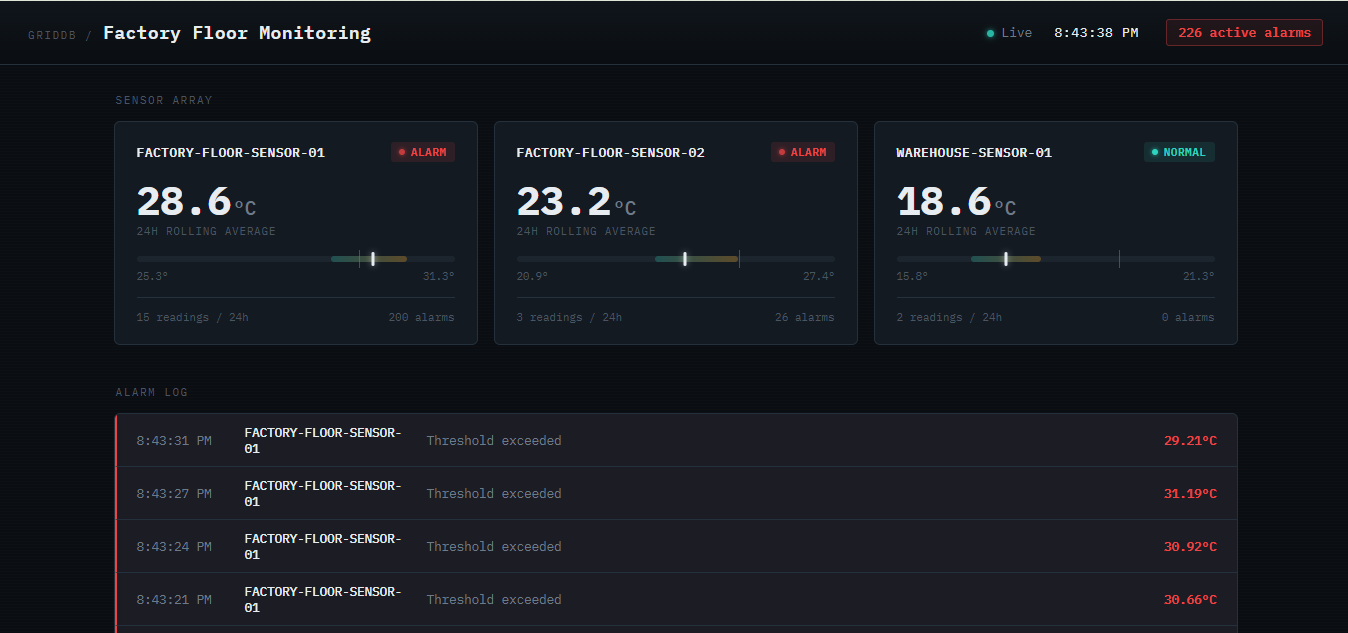
A close-up of a single device panel, showing the sparkline trend line and the min/max range gauge with the alert threshold marker.
—
Running it
docker compose up --build
Then open http://localhost:8080. Within a few seconds the device panels populate with live readings and trend lines, and if the simulated readings cross the alert threshold (27.5°C in this example), rows start appearing in the alarm log.
Terminal output of docker compose up --build completing successfully, showing GridDB’s cluster starting and the Java app connecting.
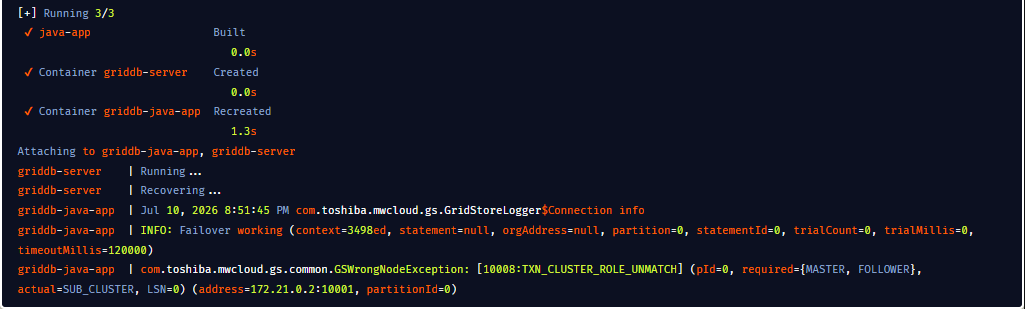
docker ps showing both containers — griddb-server and griddb-java-app — up and running on the shared bridge network.

Checking the API directly
It’s worth hitting the endpoints on their own before trusting the dashboard, both to confirm the data looks right and as a sanity check while you’re adapting this to your own sensors:
$ curl http://localhost:8080/api/stats
# [{"deviceId":"factory_floor_sensor_01","avg":26.84,"min":24.02,"max":31.97,"count":118}, ...]

$ curl http://localhost:8080/api/alerts
# [{"deviceId":"factory_floor_sensor_01","timestamp":"2026-07-01T14:22:09.441Z","temperature":29.13}, ...]
Because both routes set Access-Control-Allow-Origin: *, they’re also easy to point a separate front end or a tool like Grafana’s JSON API plugin at, if the bundled dashboard ends up being a placeholder for something more elaborate.
—
Conclusion
GridDB’s native time-series support, high write throughput, and straightforward Docker integration make it a strong fit for factory monitoring: TimeSeries containers handle the append-heavy, time-ordered access pattern that sensor data naturally produces, without the index maintenance and partitioning work a general-purpose relational table would require at the same scale.
The full source for this project — the five Java classes, Dockerfile, and docker-compose.yml — is available on GitHub: dagmawit-sudo-cloud/griddb-dashboard-demo.
References
- GridDB Java API Reference – https://www.griddb.net/en/resources/griddb-java-api-reference/
- GridDB GitHub Repository – https://github.com/griddb/griddb
- Docker Documentation – https://docs.docker.com/
- Chart.js Documentation – https://www.chartjs.org/docs/latest/