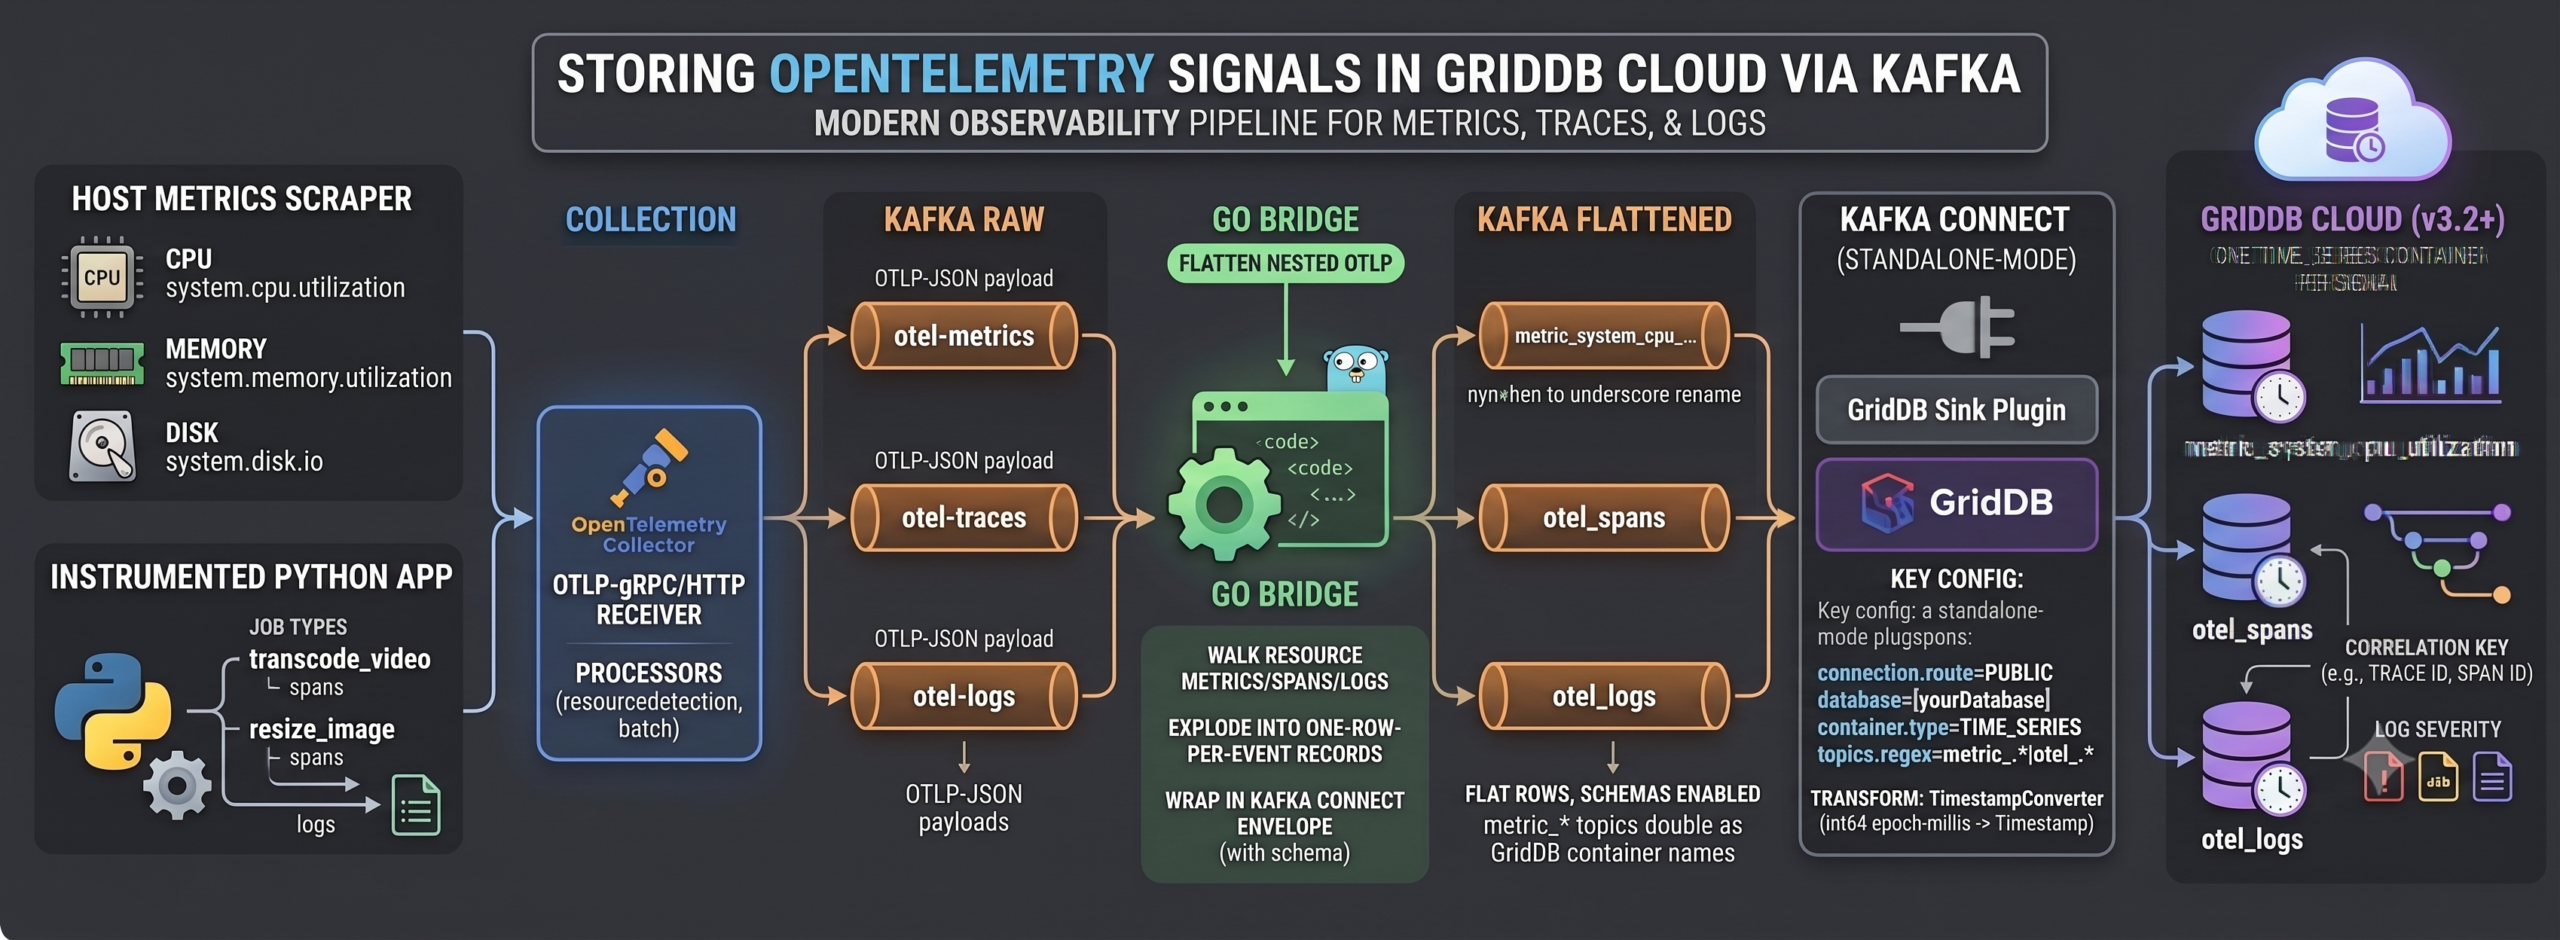
OpenTelemetry (OTel) is an open-source, vendor-neutral observability framework for cloud-native software. Rather than tying an application to a single monitoring vendor, it defines a common way to generate, collect, and export telemetry across three signal types: metrics, traces, and logs; commonly called the three pillars of observability. Metrics are numeric measurements sampled over time, such as CPU utilization or request counts. Traces describe the path of a single request as it moves through a system, broken into individual units of work called spans. Logs are timestamped event records emitted by the application.
The value of the three pillars comes from being able to correlate across them: spotting a latency spike in a trace, then jumping to the exact log lines emitted during that request. Realizing that benefit requires the signals to live somewhere you can query them together, which is where GridDB Cloud comes in. All three signals are, at their core, streams of timestamped events, making them a natural fit for a time-series database.
We have written extensively about pairing Kafka with GridDB, because a data-ingestion pipeline like Kafka fits well with what GridDB is built for. Previously we used the GridDB Kafka Connector to push time-series data to GridDB Cloud over the Web API. With the release of GridDB Cloud v3.2, we can now connect to a cloud instance natively, without the Web API, which opens up a broader set of tools. In this article, we will use that native connection to land all three OpenTelemetry signals into GridDB Cloud through Kafka. We will collect host metrics from a local machine, instrument a small application to emit traces and logs, route everything through Kafka, flatten the nested OTLP payloads with a Go bridge, and sink each signal into its own GridDB Cloud TIME_SERIES container using the GridDB Kafka Connector. We will then write queries that analyze the data, per-operation latency profiles, error rates, metric summaries, and a cross-signal lookup that connects a failing trace to the logs it produced.
GridDB’s design favors one container per series, TIME_SERIES containers are optimized per series, and a query scoped to a single container is faster than filtering one large mixed container. That principle shapes the whole pipeline: rather than dumping raw OTLP into one place, we explode it into one container per metric, plus one container each for spans and logs.
At a high level, this is what we will build:
- Set up the OpenTelemetry Collector to scrape host metrics and receive application traces and logs, pushing each signal to Kafka.
- Set up Kafka to receive and store the raw OTLP data.
- Run a Go “bridge” that reads the dense, nested OTLP JSON and explodes it into flat, one-row-per-event topics — one per metric, one for spans, one for logs.
- Use the GridDB Kafka Connector to sink those flattened topics into GridDB Cloud.
host metrics ─┐
                  ├─► OTel Collector ─► Kafka  [otel-metrics] [otel-traces] [otel-logs]
Instrumented app ─┘                                       │
                                                       Go bridge  (flatten nested OTLP)
                                                          │
        Kafka  [metric_system_cpu_utilization, ...]  [otel_spans]  [otel_logs]
                                                          │
                                              Kafka Connect (GridDB sink)
                                                          │
                          GridDB Cloud — one TIME_SERIES container per signal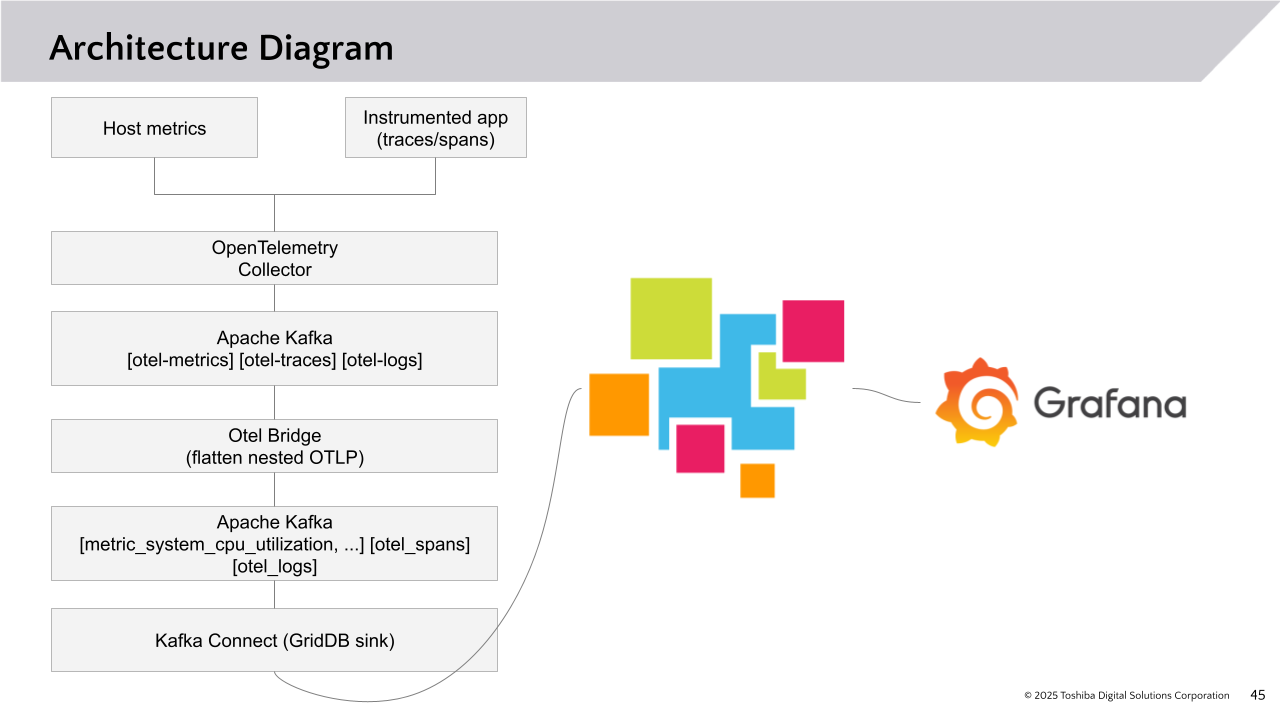
One naming detail to note up front: the raw input topics use hyphens (otel-metrics, otel-traces, otel-logs) and the bridge’s flattened output topics use underscores (metric_*, otel_spans, otel_logs). The output names double as GridDB container names, and the hyphen/underscore split lets the sink’s topic filter target only the flattened topics.
OpenTelemetry
Install OpenTelemetry from opentelemetry.io. In this case the Collector was installed on bare metal. Once installed, configure config.yaml to describe how the Collector should behave. The configuration below sets up all three pillars: the hostmetrics scraper produces metrics, while the otlp receiver accepts traces and logs from an instrumented application. Each pipeline exports to Kafka with OTLP-JSON encoding:
receivers:
  otlp:
    protocols:
      grpc:
        endpoint: 0.0.0.0:4317
      http:
        endpoint: 0.0.0.0:4318
  hostmetrics:
    collection_interval: 10s
    scrapers:
      cpu:
        metrics:
          system.cpu.utilization:
            enabled: true
      memory:
        metrics:
          system.memory.utilization:
            enabled: true
      load:
      disk:

processors:
  resourcedetection:
    detectors: [system]
    system:
      hostname_sources: [os]
  batch:
    timeout: 5s
    send_batch_size: 100

exporters:
  kafka:
    brokers:
      - localhost:9092
    metrics:
      topic: otel-metrics
      encoding: otlp_json
    traces:
      topic: otel-traces
      encoding: otlp_json
    logs:
      topic: otel-logs
      encoding: otlp_json
  debug:
    verbosity: basic

service:
  pipelines:
    metrics:
      receivers: [otlp, hostmetrics]
      processors: [resourcedetection, batch]
      exporters: [kafka, debug]
    traces:
      receivers: [otlp]
      processors: [resourcedetection, batch]
      exporters: [kafka, debug]
    logs:
      receivers: [otlp]
      processors: [resourcedetection, batch]
      exporters: [kafka, debug]
The hostmetrics scraper is the metrics source, configured at the bottom of the file in the metrics pipeline; it exports to the otel-metrics topic. The resourcedetection processor attaches the host’s name to every signal as a resource attribute. Start the Collector by pointing it at the config:
$ otelcol-contrib --config ~/otel-griddb/config.yamlInstrumenting an Application for Traces and Logs
Host metrics arrive on their own through the scraper, but in a real world setting, you’d want to be collecting traces and logs coming from the application you’re monitoring. To mimic this sort of real-world-use-case, we have set up a small Python worker that simulates processing jobs and instrument it with OpenTelemetry’s auto-instrumentation. Auto-instrumentation works well in this case because the application does not need an SDK wired in by hand; the opentelemetry-instrument launcher configures everything based on the environment variables including the providers, exporters, and the logging handler.
A representative worker:
import logging
import random
import time
import uuid

from opentelemetry import trace

logging.basicConfig(level=logging.INFO, format="%(asctime)s %(levelname)s %(message)s")
log = logging.getLogger("job-worker")
tracer = trace.get_tracer("job-worker")

JOB_TYPES = ["transcode_video", "resize_image", "send_email", "build_report"]


def process_job(job_type: str, job_id: str) -> None:
    with tracer.start_as_current_span(job_type) as span:
        span.set_attribute("job.id", job_id)
        span.set_attribute("job.type", job_type)

        duration = random.uniform(0.05, 1.5)
        log.info("job %s (%s) started", job_id, job_type)
        time.sleep(duration)

        if random.random() < 0.1:  # occasionally fail, so the data has errors to query
            span.set_status(trace.Status(trace.StatusCode.ERROR, "job failed"))
            log.error("job %s (%s) failed after %.2fs", job_id, job_type, duration)
            return

        log.info("job %s (%s) completed in %.2fs", job_id, job_type, duration)


def main() -> None:
    log.info("worker starting")
    while True:
        job_type = random.choice(JOB_TYPES)
        process_job(job_type, uuid.uuid4().hex[:8])
        time.sleep(random.uniform(0.2, 0.8))


if __name__ == "__main__":
    main()
Telemetry destinations are set through environment variables, which the launcher reads to decide where to send spans and logs:
$ export OTEL_EXPORTER_OTLP_ENDPOINT=http://localhost:4317
$ export OTEL_EXPORTER_OTLP_PROTOCOL=grpc
$ export OTEL_SERVICE_NAME=job-worker
$ export OTEL_TRACES_EXPORTER=otlp
$ export OTEL_LOGS_EXPORTER=otlp
$ export OTEL_METRICS_EXPORTER=none
Run the worker under the launcher:
$ opentelemetry-instrument python worker.py
As a tip, you can keep these exports in a file (for example otel-env.sh) and load them with source otel-env.sh. Pasting a multi-line block directly into a shell can silently corrupt the values if the newlines arrive as the literal characters \n — each variable then absorbs the leftover export keyword, producing names such as otlpnexport that fail at startup with Requested component 'otlpnexport' not found. Sourcing a file avoids the issue.
The OTEL_SERVICE_NAME value is attached to every span and log as the service.name resource attribute, which the bridge promotes to a dedicated column.
Kafka
This setup uses the KRaft build of Kafka, which no longer requires a separate ZooKeeper process. Install Kafka and start it by pointing at the default config; installed via Homebrew, it starts like this:
$ kafka-server-start $(brew --prefix)/etc/kafka/kraft/server.propertiesKafka Plugins and the GridDB Sink
Wiring Kafka to GridDB Cloud requires the GridDB connector and its supporting gridstore JARs. Gather them into a directory of your choosing — here, a griddb subdirectory under a kafka-plugins folder in the home directory:
$ ➜  ls ~/kafka-plugins/griddb
$ griddb-kafka-connector-0.6.jar        gridstore-conf-5.8.0.jar
$ gridstore-5.8.0.jar                   gridstore-jdbc-5.8.0.jar
$ gridstore-advanced-5.8.0.jar          gridstore-jdbc-call-logging-5.8.0.jar
$ gridstore-call-logging-5.8.0.jar
These JARs are gathered from the GridDB Cloud v3.2 support page. You will also need to build the GridDB Kafka Connector from this fork, which adds support for the connection.route and database configuration properties required for GridDB Cloud’s native connection.
> Author note: Link the v3.2 support page (the [TODO v3.2 BLOG] reference from the original draft).
Kafka Connect
Kafka Connect needs a connect-standalone.properties worker configuration. Because the bridge emits Kafka Connect envelopes that carry an explicit schema, the value converter must have schemas enabled:
# connect-standalone.properties

bootstrap.servers=localhost:9092

key.converter=org.apache.kafka.connect.json.JsonConverter
value.converter=org.apache.kafka.connect.json.JsonConverter
key.converter.schemas.enable=false
value.converter.schemas.enable=true

offset.storage.file.filename=/tmp/connect.offsets
offset.flush.interval.ms=10000

# Directory above the griddb folder; Connect scans subdirectories for plugins
plugin.path=/Users/israelimru/kafka-plugins

rest.port=8083
The sink configuration tells Connect how to push data to GridDB Cloud. A single sink handles all three signal types: every flattened topic — metrics, spans, and logs — carries a datetime field and maps to a TIME_SERIES container, so one topic filter and one timestamp transform cover them all. The TimestampConverter is essential: it coerces the integer epoch-millis datetime into a real Timestamp, which is what makes GridDB create a TIME_SERIES container keyed on time rather than a collection with a plain integer column.
name=griddb-otel-sink
connector.class=com.github.griddb.kafka.connect.GriddbSinkConnector
tasks.max=1

cluster.name=[yourClusterName]
user=[yourUser]
password=[yourPassword]
multicast=false
notification.provider.url=[yourNotificationProviderURL]

connection.route=PUBLIC
database=[yourDatabase]

container.type=TIME_SERIES
topics.regex=metric_.*|otel_.*

# Coerce the int64 epoch-millis datetime into a Timestamp before mapping,
# so datetime becomes the TIMESTAMP row key of each TIME_SERIES container.
transforms=TimestampConverter
transforms.TimestampConverter.type=org.apache.kafka.connect.transforms.TimestampConverter$Value
transforms.TimestampConverter.field=datetime
transforms.TimestampConverter.target.type=Timestamp
The topics.regex=metric_.|otel_. pattern matches the underscore output topics (metric_system_cpu_utilization, otel_spans, otel_logs) while ignoring the hyphenated raw inputs. Start the Connect worker with both files:
$ connect-standalone ~/otel-griddb/connect-standalone.properties ~/otel-griddb/griddb-otel-sink.properties
The connect-standalone command runs the Kafka Connect worker — the link between Kafka topics and external systems. It loads the GridDB sink plugin and starts the job defined in the sink properties, which consumes from the matching topics and writes each record as a row in GridDB Cloud.
The Go Bridge
OTLP JSON is deeply nested. A metrics message wraps resourceMetrics → scopeMetrics → metrics → dataPoints; a traces message wraps resourceSpans → scopeSpans → spans; logs follow the same shape. GridDB stores flat rows, so the bridge reads each raw OTLP topic and explodes it into flat, one-row-per-event records, each wrapped in a Kafka Connect envelope carrying its schema. The main loop dispatches on the source topic:
switch rec.Topic {
case metricsTopic:                  // otel-metrics
    produced, err = explode(rec.Value)
case tracesTopic:                   // otel-traces
    produced, err = explodeTraces(rec.Value)
case logsTopic:                     // otel-logs
    produced, err = explodeLogs(rec.Value)
}
Metrics
The metrics handler walks down to each data point and emits one flat row per point, routing it to a per-metric topic (metricToTopic turns system.cpu.utilization into metric_system_cpu_utilization):
func explode(payload []byte) ([]*kgo.Record, error) {
	var o otlpMetrics
	if err := json.Unmarshal(payload, &o); err != nil {
		return nil, fmt.Errorf("unmarshal otlp: %w", err)
	}

	var out []*kgo.Record
	for _, rm := range o.ResourceMetrics {
		host := hostFromResource(rm.Resource)
		for _, sm := range rm.ScopeMetrics {
			for _, m := range sm.Metrics {
				var series *dataSeries
				switch {
				case m.Gauge != nil:
					series = m.Gauge
				case m.Sum != nil:
					series = m.Sum
				default:
					continue // histograms not supported
				}

				topic := metricToTopic(m.Name)
				for _, dp := range series.DataPoints {
					val, ok := dpValue(dp)
					if !ok {
						continue
					}
					nanos, err := strconv.ParseInt(dp.TimeUnixNano, 10, 64)
					if err != nil {
						continue
					}
					envelope := connectEnvelope{
						Schema: flatSchema,
						Payload: flatRow{
							Datetime: nanos / 1_000_000,
							Value:    val,
							Host:     host,
							Unit:     m.Unit,
							Attrs:    attrsToString(dp.Attributes),
						},
					}
					b, _ := json.Marshal(envelope)
					out = append(out, &kgo.Record{Topic: topic, Value: b})
				}
			}
		}
	}
	return out, nil
}
Traces
The traces handler pulls service.name and host.name from the resource, iterates down to individual spans, converts nanosecond timestamps to milliseconds, and computes each span’s duration from its start and end times:
func explodeTraces(payload []byte) ([]*kgo.Record, error) {
	var o otlpTraces
	if err := json.Unmarshal(payload, &o); err != nil {
		return nil, fmt.Errorf("unmarshal otlp traces: %w", err)
	}

	var out []*kgo.Record
	for _, rs := range o.ResourceSpans {
		host := resourceAttr(rs.Resource, "host.name")
		service := resourceAttr(rs.Resource, "service.name")
		for _, ss := range rs.ScopeSpans {
			for _, s := range ss.Spans {
				startNs, err1 := strconv.ParseInt(s.StartTimeUnixNano, 10, 64)
				endNs, err2 := strconv.ParseInt(s.EndTimeUnixNano, 10, 64)
				if err1 != nil || err2 != nil {
					continue
				}
				envelope := spanEnvelope{
					Schema: spanSchema,
					Payload: spanRow{
						Datetime:     startNs / 1_000_000,
						DurationMs:   (endNs - startNs) / 1_000_000,
						TraceID:      s.TraceID,
						SpanID:       s.SpanID,
						ParentSpanID: s.ParentSpanID,
						Name:         s.Name,
						Kind:         s.Kind,
						StatusCode:   s.Status.Code,
						ServiceName:  service,
						Host:         host,
						Attrs:        attrsToString(s.Attributes),
					},
				}
				b, _ := json.Marshal(envelope)
				out = append(out, &kgo.Record{Topic: spansContainer, Value: b})
			}
		}
	}
	return out, nil
}
Its schema leaves datetime as int64; the sink’s TimestampConverter promotes it to a GridDB TIMESTAMP row key:
var spanSchema = connectSchema{
	Type: "struct",
	Name: "otel_span",
	Fields: []connectField{
		{Type: "int64", Optional: false, Field: "datetime"},
		{Type: "int64", Optional: false, Field: "duration_ms"},
		{Type: "string", Optional: true, Field: "trace_id"},
		{Type: "string", Optional: true, Field: "span_id"},
		{Type: "string", Optional: true, Field: "parent_span_id"},
		{Type: "string", Optional: true, Field: "name"},
		{Type: "int32", Optional: true, Field: "kind"},
		{Type: "int32", Optional: true, Field: "status_code"},
		{Type: "string", Optional: true, Field: "service_name"},
		{Type: "string", Optional: true, Field: "host"},
		{Type: "string", Optional: true, Field: "attrs"},
	},
}
Logs
The logs handler is structurally identical, walking resourceLogs → scopeLogs → logRecords and emitting one flat row per record to the otel_logs topic. Each row carries the record’s severity number and text, its body, the service.name/host.name from the resource, and — critically — the trace_id and span_id that tie the log back to the span that produced it. That correlation key is the reason for landing logs and traces in the same database, and we use it in the queries below.
Build and run the bridge:
$ go build -o bridge
$ ./bridge
It logs each input record it explodes:
2026/05/15 13:31:36 topic=otel-metrics offset=150 exploded into 58 records
2026/05/15 13:31:37 topic=otel-traces  offset=151 exploded into 12 records
2026/05/15 13:31:37 topic=otel-logs    offset=149 exploded into 9 records
Running Everything
With every piece in place, start the components in order:
- Kafka (KRaft)
- OTel Collector
- The instrumented worker (
opentelemetry-instrument python worker.py) - The Go bridge
- Kafka Connect (
connect-standalone)
Once running, Kafka Connect reports writing rows to GridDB Cloud, with a container per metric plus the span and log containers:
[griddb-otel-sink|task-0] Put 1 record to buffer of container metric_system_cpu_load_average_15m
[griddb-otel-sink|task-0] Put 1 record to buffer of container metric_system_disk_io
[griddb-otel-sink|task-0] Put 1 record to buffer of container otel_spans
[griddb-otel-sink|task-0] Put 1 record to buffer of container otel_logs
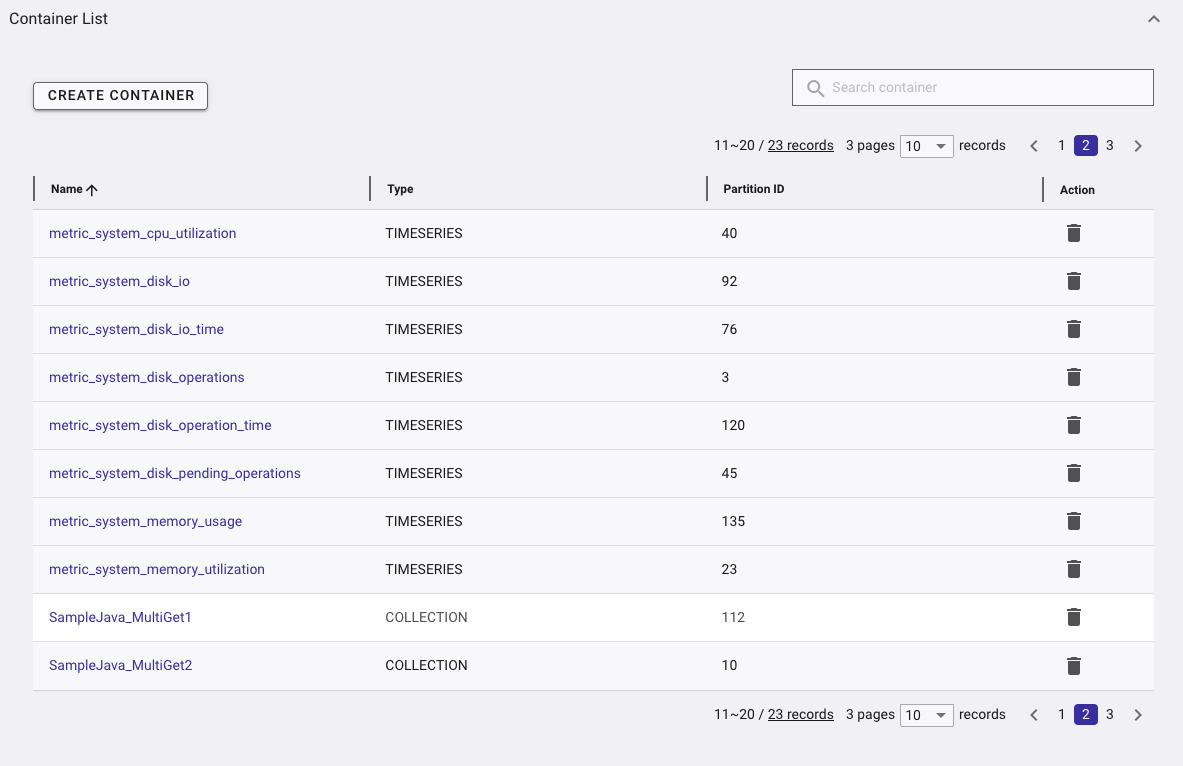
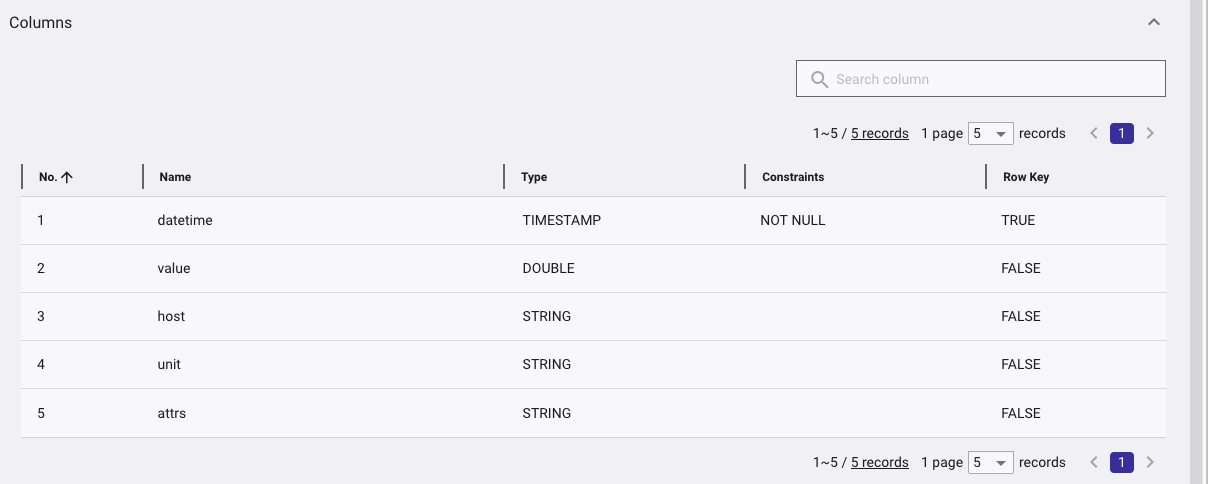
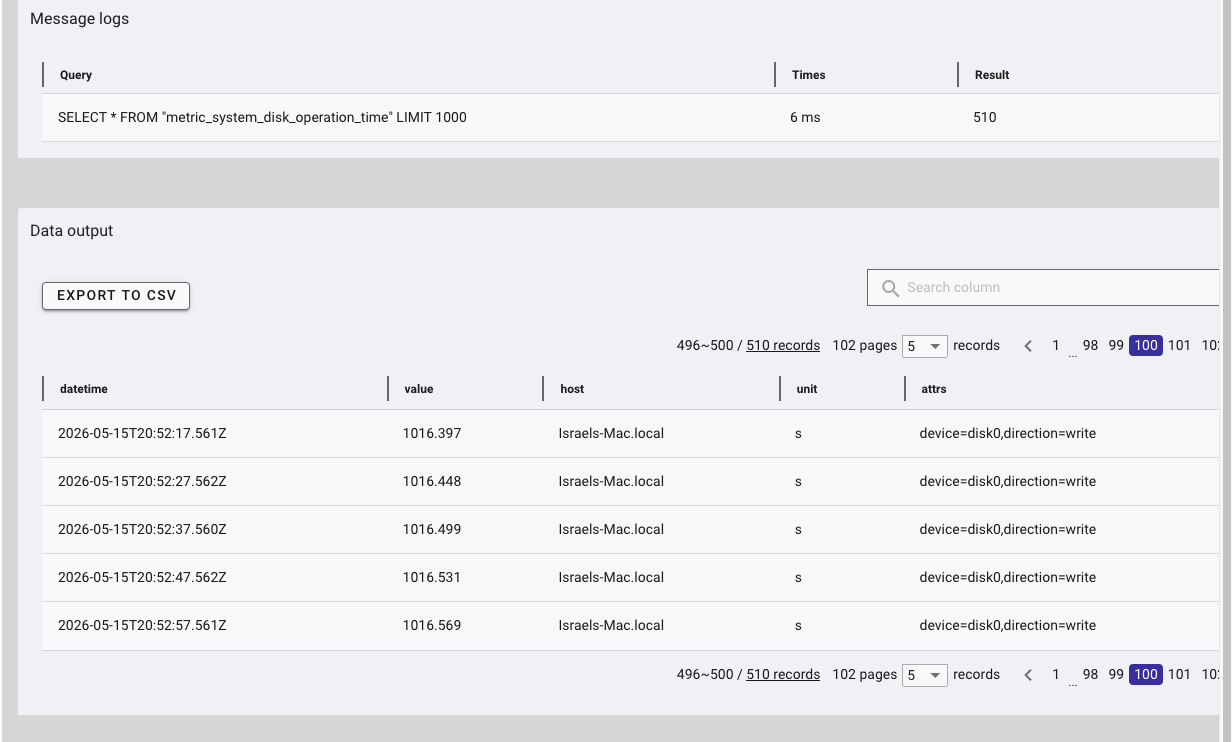
In the GridDB Cloud console, the containers appear as TIME_SERIES. The otel_spans container holds one row per span — datetime (the span start) as the TIMESTAMP row key, plus duration_ms, the ID fields (trace_id, span_id, parent_span_id), the operation name, kind, status_code, service_name, host, and a flattened attrs string. The otel_logs container holds one row per log record, keyed on datetime, with severity_number, severity_text, body, trace_id, span_id, service_name, host, and attrs. Each metric_* container holds datetime, value, host, unit, and attrs.
Here’s a brief look at what our data looks like in the GridDB Cloud Portal
Querying the Data
Storing telemetry is only useful if you can ask questions of it. The following queries move from simple feeds to genuine analysis, one pillar at a time, and finish by crossing between them.
Metrics
For a single metric, a one-line aggregate summarizes its range over the whole collection period — useful for spotting how much disk io has run:
SELECT MIN(value) AS min_util,
       AVG(value) AS avg_util,
       MAX(value) AS max_util
FROM metric_system_disk_io;
Example run using the GridDB Cloud CLI Tool:
$ ➜  ~ griddb-cloud-cli sql query -s "SELECT MIN(value) AS min_util, AVG(value) AS avg_util, MAX(value) AS max_util FROM metric_system_disk_io;" -r
$ [{"stmt": "SELECT MIN(value) AS min_util, AVG(value) AS avg_util, MAX(value) AS max_util FROM metric_system_disk_io;" }]
$ min_util,avg_util,max_util,
$ [1.00627853312e+11 1.2719715549835805e+11 3.24776685568e+11]
The latest readings give a live view of a single series:
SELECT datetime, value, host
FROM metric_system_disk_io
ORDER BY datetime DESC
LIMIT 20;
Example run:
$ ➜  ~ griddb-cloud-cli sql query -s "SELECT datetime, value, host FROM metric_system_disk_io ORDER BY datetime DESC LIMIT 20;" -r
$ [{"stmt": "SELECT datetime, value, host FROM metric_system_disk_io ORDER BY datetime DESC LIMIT 20;" }]
$ datetime,value,host,
$ [2026-05-27T20:54:31.978Z 1.65120098304e+11 Israels-Mac.local]
$ [2026-05-27T20:54:21.979Z 1.65116936192e+11 Israels-Mac.local]
$ [2026-05-27T20:54:11.979Z 1.6481210368e+11 Israels-Mac.local]
$ [2026-05-27T20:54:01.980Z 1.64800229376e+11 Israels-Mac.local]
$ [2026-05-27T20:53:51.979Z 1.64774305792e+11 Israels-Mac.local]
$ [2026-05-27T20:53:41.979Z 1.64678656e+11 Israels-Mac.local]
$ [2026-05-27T20:53:31.979Z 1.64668919808e+11 Israels-Mac.local]
$ [2026-05-27T20:53:21.980Z 1.6465928192e+11 Israels-Mac.local]
$ [2026-05-27T20:53:11.979Z 1.64600336384e+11 Israels-Mac.local]
$ [2026-05-27T20:53:01.979Z 1.64591157248e+11 Israels-Mac.local]
$ [2026-05-27T20:52:51.996Z 1.64583391232e+11 Israels-Mac.local]
$ [2026-05-27T20:52:41.980Z 1.64520382464e+11 Israels-Mac.local]
$ [2026-05-27T20:52:31.979Z 1.64511981568e+11 Israels-Mac.local]
$ [2026-05-27T20:52:21.980Z 1.64502102016e+11 Israels-Mac.local]
$ [2026-05-27T20:52:11.979Z 1.64488118272e+11 Israels-Mac.local]
$ [2026-05-27T20:52:01.979Z 1.64480098304e+11 Israels-Mac.local]
$ [2026-05-27T20:51:51.979Z 1.6446855168e+11 Israels-Mac.local]
$ [2026-05-27T20:51:41.979Z 1.6444940288e+11 Israels-Mac.local]
$ [2026-05-27T20:51:31.979Z 1.64428091392e+11 Israels-Mac.local]
$ [2026-05-27T20:51:21.979Z 1.64419739648e+11 Israels-Mac.local]
Traces
A few conventions matter for the trace and log queries. A span’s status_code is 0 for UNSET, 1 for OK, and 2 for ERROR. A log record’s severity_number follows fixed ranges: 1–4 TRACE, 5–8 DEBUG, 9–12 INFO, 13–16 WARN, 17–20 ERROR, 21–24 FATAL.
The first real question for any traced system is where the time is going. Because each span carries its own duration_ms, a single grouped query produces a full latency profile per operation — minimum, average, and maximum duration with the call count:
SELECT name,
       COUNT(*)         AS calls,
       MIN(duration_ms) AS min_ms,
       AVG(duration_ms) AS avg_ms,
       MAX(duration_ms) AS max_ms
FROM otel_spans
GROUP BY name
ORDER BY avg_ms DESC;
$ ➜ ~ griddb-cloud-cli sql query -s "SELECT name, COUNT(*) AS calls, MIN(duration_ms) AS min_ms, AVG(duration_ms) AS avg_ms, MAX(duration_ms) AS max_ms FROM otel_spans GROUP BY name ORDER BY avg_ms DESC" -r
$ [{"stmt": "SELECT name, COUNT(*) AS calls, MIN(duration_ms) AS min_ms, AVG(duration_ms) AS avg_ms, MAX(duration_ms) AS max_ms FROM otel_spans GROUP BY name ORDER BY avg_ms DESC" }]
$ name,calls,min_ms,avg_ms,max_ms,
$ [job.transcode_video 3535 11 1455.5188118811882 953212]
$ [job.generate_report 3609 12 889.7420338043779 1.000412e+06]
$ [job.sync_inventory 3569 24 285.75231157186886 2580]
$ [job.resize_image 3587 7 120.47058823529412 1619]
$ [job.send_email 3660 15 57.44672131147541 207]
A high max_ms against a low avg_ms points to intermittent outliers. To inspect those outliers directly, sort by duration:
SELECT ts, name, duration_ms, trace_id
FROM otel_spans
ORDER BY duration_ms DESC
LIMIT 10;
$ ➜ ~ griddb-cloud-cli sql query -s "SELECT ts, name, duration_ms, trace_id FROM otel_spans ORDER BY duration_ms DESC LIMIT 10" -r
$ [{"stmt": "SELECT ts, name, duration_ms, trace_id FROM otel_spans ORDER BY duration_ms DESC LIMIT 10" }]
$ ts,name,duration_ms,trace_id,
$ [2026-07-01T21:39:34.774Z job.generate_report 1.000412e+06 11bedd5adde787c507fe6700220f2719]
$ [2026-07-01T21:18:32.090Z job.transcode_video 953212 4c945d48dab3de71cf43e2be37bcc845]
$ [2026-07-01T21:16:27.534Z job.transcode_video 107162 b23966ac1330eaff79a17b0c0adeb9b4]
$ [2026-07-01T19:16:53.336Z job.transcode_video 8010 501f49c5d7a8b5e8774c2e8f013f27bf]
$ [2026-07-01T22:26:21.396Z job.transcode_video 8010 9064d16e9f05ef6e67d2b7f32bc4368a]
$ [2026-07-01T21:04:59.306Z job.transcode_video 8007 1a96c129efbba1ab93fc5263242b9f52]
$ [2026-07-01T20:22:30.204Z job.transcode_video 8007 ad9e78a3ab6f3ab1bc21c9454395f6c5]
$ [2026-07-01T20:44:08.697Z job.transcode_video 8006 b7429f02f990a3e7decd314ec8a61e45]
$ [2026-07-01T20:29:03.554Z job.transcode_video 8006 84f1aa7a770aa5fc29ca409e71b93b6a]
$ [2026-07-01T20:03:24.204Z job.transcode_video 8006 57207e6dedc7c6e24e76cb061e8e7022]
Reliability is the next question. Since status_code = 2 marks an errored span, error counts per operation come from a single filtered aggregate:
SELECT name, COUNT(*) AS errors
FROM otel_spans
WHERE status_code = 2
GROUP BY name
ORDER BY errors DESC;
$ ➜ ~ griddb-cloud-cli sql query -s "SELECT name, COUNT(*) AS errors FROM otel_spans WHERE status_code = 2 GROUP BY name ORDER BY errors DESC" -r
$ [{"stmt": "SELECT name, COUNT(*) AS errors FROM otel_spans WHERE status_code = 2 GROUP BY name ORDER BY errors DESC" }]
$ name,errors,
$ [job.generate_report 344]
$ [job.transcode_video 208]
$ [job.sync_inventory 142]
$ [job.resize_image 69]
$ [job.send_email 34]Logs
A severity breakdown gives a quick health summary:
SELECT severity_text, COUNT(*) AS count
FROM otel_logs
GROUP BY severity_text
ORDER BY count DESC;
$ ➜ ~ griddb-cloud-cli sql query -s "SELECT severity_text, COUNT(*) AS count FROM otel_logs GROUP BY severity_text ORDER BY count DESC" -r
$ [{"stmt": "SELECT severity_text, COUNT(*) AS count FROM otel_logs GROUP BY severity_text ORDER BY count DESC" }]
$ severity_text,count,
$ [INFO 17174]
$ [ERROR 797]Filtering on the severity number isolates everything at ERROR level or above:
SELECT datetime, severity_text, service_name, body
FROM otel_logs
WHERE severity_number >= 17
ORDER BY datetime DESC
LIMIT 20;
$ ➜ ~ griddb-cloud-cli sql query -s "SELECT ts, severity_text, service_name, body FROM otel_logs WHERE severity_number >= 17 ORDER BY ts DESC LIMIT 20" -r
$ [{"stmt": "SELECT ts, severity_text, service_name, body FROM otel_logs WHERE severity_number >= 17 ORDER BY ts DESC LIMIT 20" }]
$ ts,severity_text,service_name,body,
$ [2026-07-01T22:48:29.403Z ERROR job-worker job d9dd3342 (generate_report) failed after 0.47s: rate limited]
$ [2026-07-01T22:48:18.950Z ERROR job-worker job 070712fb (sync_inventory) failed after 0.06s: invalid payload]
$ [2026-07-01T22:48:13.213Z ERROR job-worker job d56f92f3 (generate_report) failed after 0.39s: downstream timeout]
$ [2026-07-01T22:48:11.816Z ERROR job-worker job 05ef9096 (generate_report) failed after 0.25s: invalid payload]
$ [2026-07-01T22:48:00.613Z ERROR job-worker job 4441a1ec (transcode_video) failed after 3.86s: downstream timeout]
$ [2026-07-01T22:47:55.657Z ERROR job-worker job 48491076 (generate_report) failed after 0.64s: connection refused]
$ [2026-07-01T22:47:28.637Z ERROR job-worker job 51316b2b (transcode_video) failed after 0.17s: rate limited]
$ [2026-07-01T22:47:26.343Z ERROR job-worker job b554b041 (transcode_video) failed after 0.53s: connection refused]
$ [2026-07-01T22:47:24.968Z ERROR job-worker job 3e71df8a (generate_report) failed after 0.67s: downstream timeout]
$ [2026-07-01T22:47:14.096Z ERROR job-worker job 31e1be77 (transcode_video) failed after 0.05s: invalid payload]
$ [2026-07-01T22:47:12.386Z ERROR job-worker job f638a350 (transcode_video) failed after 0.75s: connection refused]
$ [2026-07-01T22:47:01.852Z ERROR job-worker job 3fe1ac79 (generate_report) failed after 0.45s: invalid payload]
$ [2026-07-01T22:46:36.300Z ERROR job-worker job 346819a2 (generate_report) failed after 1.38s: downstream timeout]
$ [2026-07-01T22:46:28.549Z ERROR job-worker job 483cabb8 (resize_image) failed after 0.05s: connection refused]
$ [2026-07-01T22:46:14.511Z ERROR job-worker job c438270a (transcode_video) failed after 0.09s: connection refused]
$ [2026-07-01T22:45:49.406Z ERROR job-worker job 60e89b69 (generate_report) failed after 0.46s: connection refused]
$ [2026-07-01T22:45:14.076Z ERROR job-worker job e3404a92 (send_email) failed after 0.09s: rate limited]
$ [2026-07-01T22:45:11.384Z ERROR job-worker job e5eaabd8 (generate_report) failed after 1.36s: invalid payload]
$ [2026-07-01T22:45:08.027Z ERROR job-worker job e207ee04 (generate_report) failed after 1.64s: invalid payload]
$ [2026-07-01T22:44:55.155Z ERROR job-worker job 3af41a8b (generate_report) failed after 1.43s: invalid payload]Crossing Signals
The most compelling result of collectingg traces and logs in the same database is correlation. Suppose the error query above flags an operation that fails often. We can take its most recent failing trace and pull every log record emitted during that exact request, joined on trace_id. First identify the trace:
SELECT trace_id, name, duration_ms
FROM otel_spans
WHERE status_code = 2
ORDER BY datetime DESC
LIMIT 1;
$ ➜ ~ griddb-cloud-cli sql query -s "SELECT trace_id, name, duration_ms FROM otel_spans WHERE status_code = 2 ORDER BY ts DESC LIMIT 1" -r
$ [{"stmt": "SELECT trace_id, name, duration_ms FROM otel_spans WHERE status_code = 2 ORDER BY ts DESC LIMIT 1" }]
$ trace_id,name,duration_ms,
$ [693c5d8f3479288991b91dafd43d20f1 job.generate_report 473]Then retrieve its logs in order:
SELECT datetime, severity_text, body, span_id
FROM otel_logs
WHERE trace_id = '<trace_id from the previous result>'
ORDER BY datetime;
$ ➜ ~ griddb-cloud-cli sql query -s "SELECT ts, severity_text, body, span_id FROM otel_logs WHERE trace_id = '693c5d8f3479288991b91dafd43d20f1' ORDER BY ts" -r
$ [{"stmt": "SELECT ts, severity_text, body, span_id FROM otel_logs WHERE trace_id = '693c5d8f3479288991b91dafd43d20f1' ORDER BY ts" }]
$ ts,severity_text,body,span_id,
$ [2026-07-01T22:48:29.403Z ERROR job d9dd3342 (generate_report) failed after 0.47s: rate limited 7492c1f55f487fe2]In two short queries we go from “this operation is failing” to the precise log lines explaining why an investigation that typically spans two separate systems, performed here against one database.
Conclusion
With this pipeline in place, all three OpenTelemetry signals land in GridDB Cloud through a single path: the Collector handles ingestion and fan-out to Kafka, the Go bridge flattens nested OTLP into one clean row per event, and the GridDB Kafka Connector — using GridDB Cloud v3.2’s native connection — sinks each signal into a purpose-built TIME_SERIES container. Because the data is queryable with standard aggregates and the trace identifier is shared between spans and logs, GridDB becomes a single backend for the correlated analysis that observability work depends on: metric summaries, latency profiling, error attribution, and trace-to-log drilldown.