Introduction
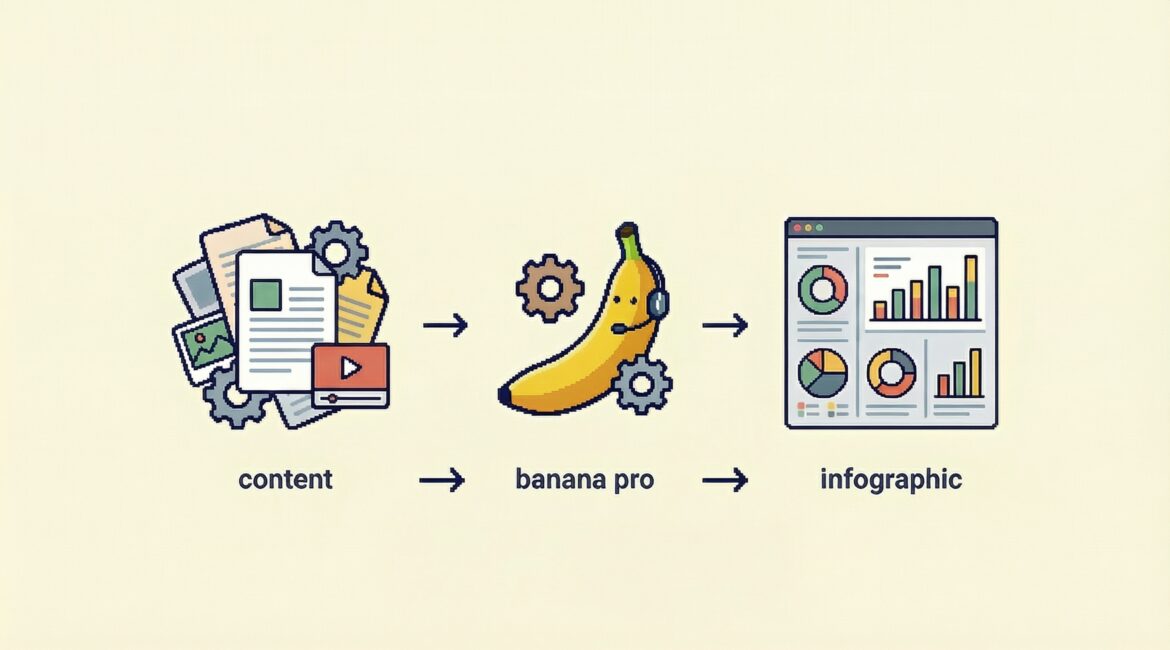
Forget the old times when you had to manually create infographics. With Nano Banana Pro, you can now create stunning infographics in minutes.
Nano Banana Pro is an advanced AI image generation and editing model developed by Google DeepMind as part of the Gemini AI family. It’s essentially a professional grade tool for creating high-quality visuals—like illustrations, infographics, mockups, and edited photos using natural language text prompts or reference images.
In this blog post, we will build a web application that leverages Nano Banana Pro to generate stunning infographics from any accessible content such as articles, and store the generated infographics data using GridDB as the high-performance database backend.
Running the Application
To run this application, you need to:
- Clone this repository and run the following commands:
$     git clone https://github.com/junwatu/infographic-nbp-griddb.git
$     cd infographic-nbp-griddb/apps
$     npm install
- Set up the environment variables. Copy the
.env.examplefile to.envand fill in the values:
$     WEB_URL=http://localhost:3000

$     # GridDB Web API Configuration (Primary)
$     GRIDDB_WEBAPI_URL=""
$     GRIDDB_USERNAME=""
$     GRIDDB_PASSWORD=""

$     # DeepSeek API key through Anthropic-compatible endpoint
$     NEBIUS_API_KEY=""

$     # Nano Banana Pro through Fal API
$     FAL_KEY=""
- Start the application:
$ npm run dev
- Open
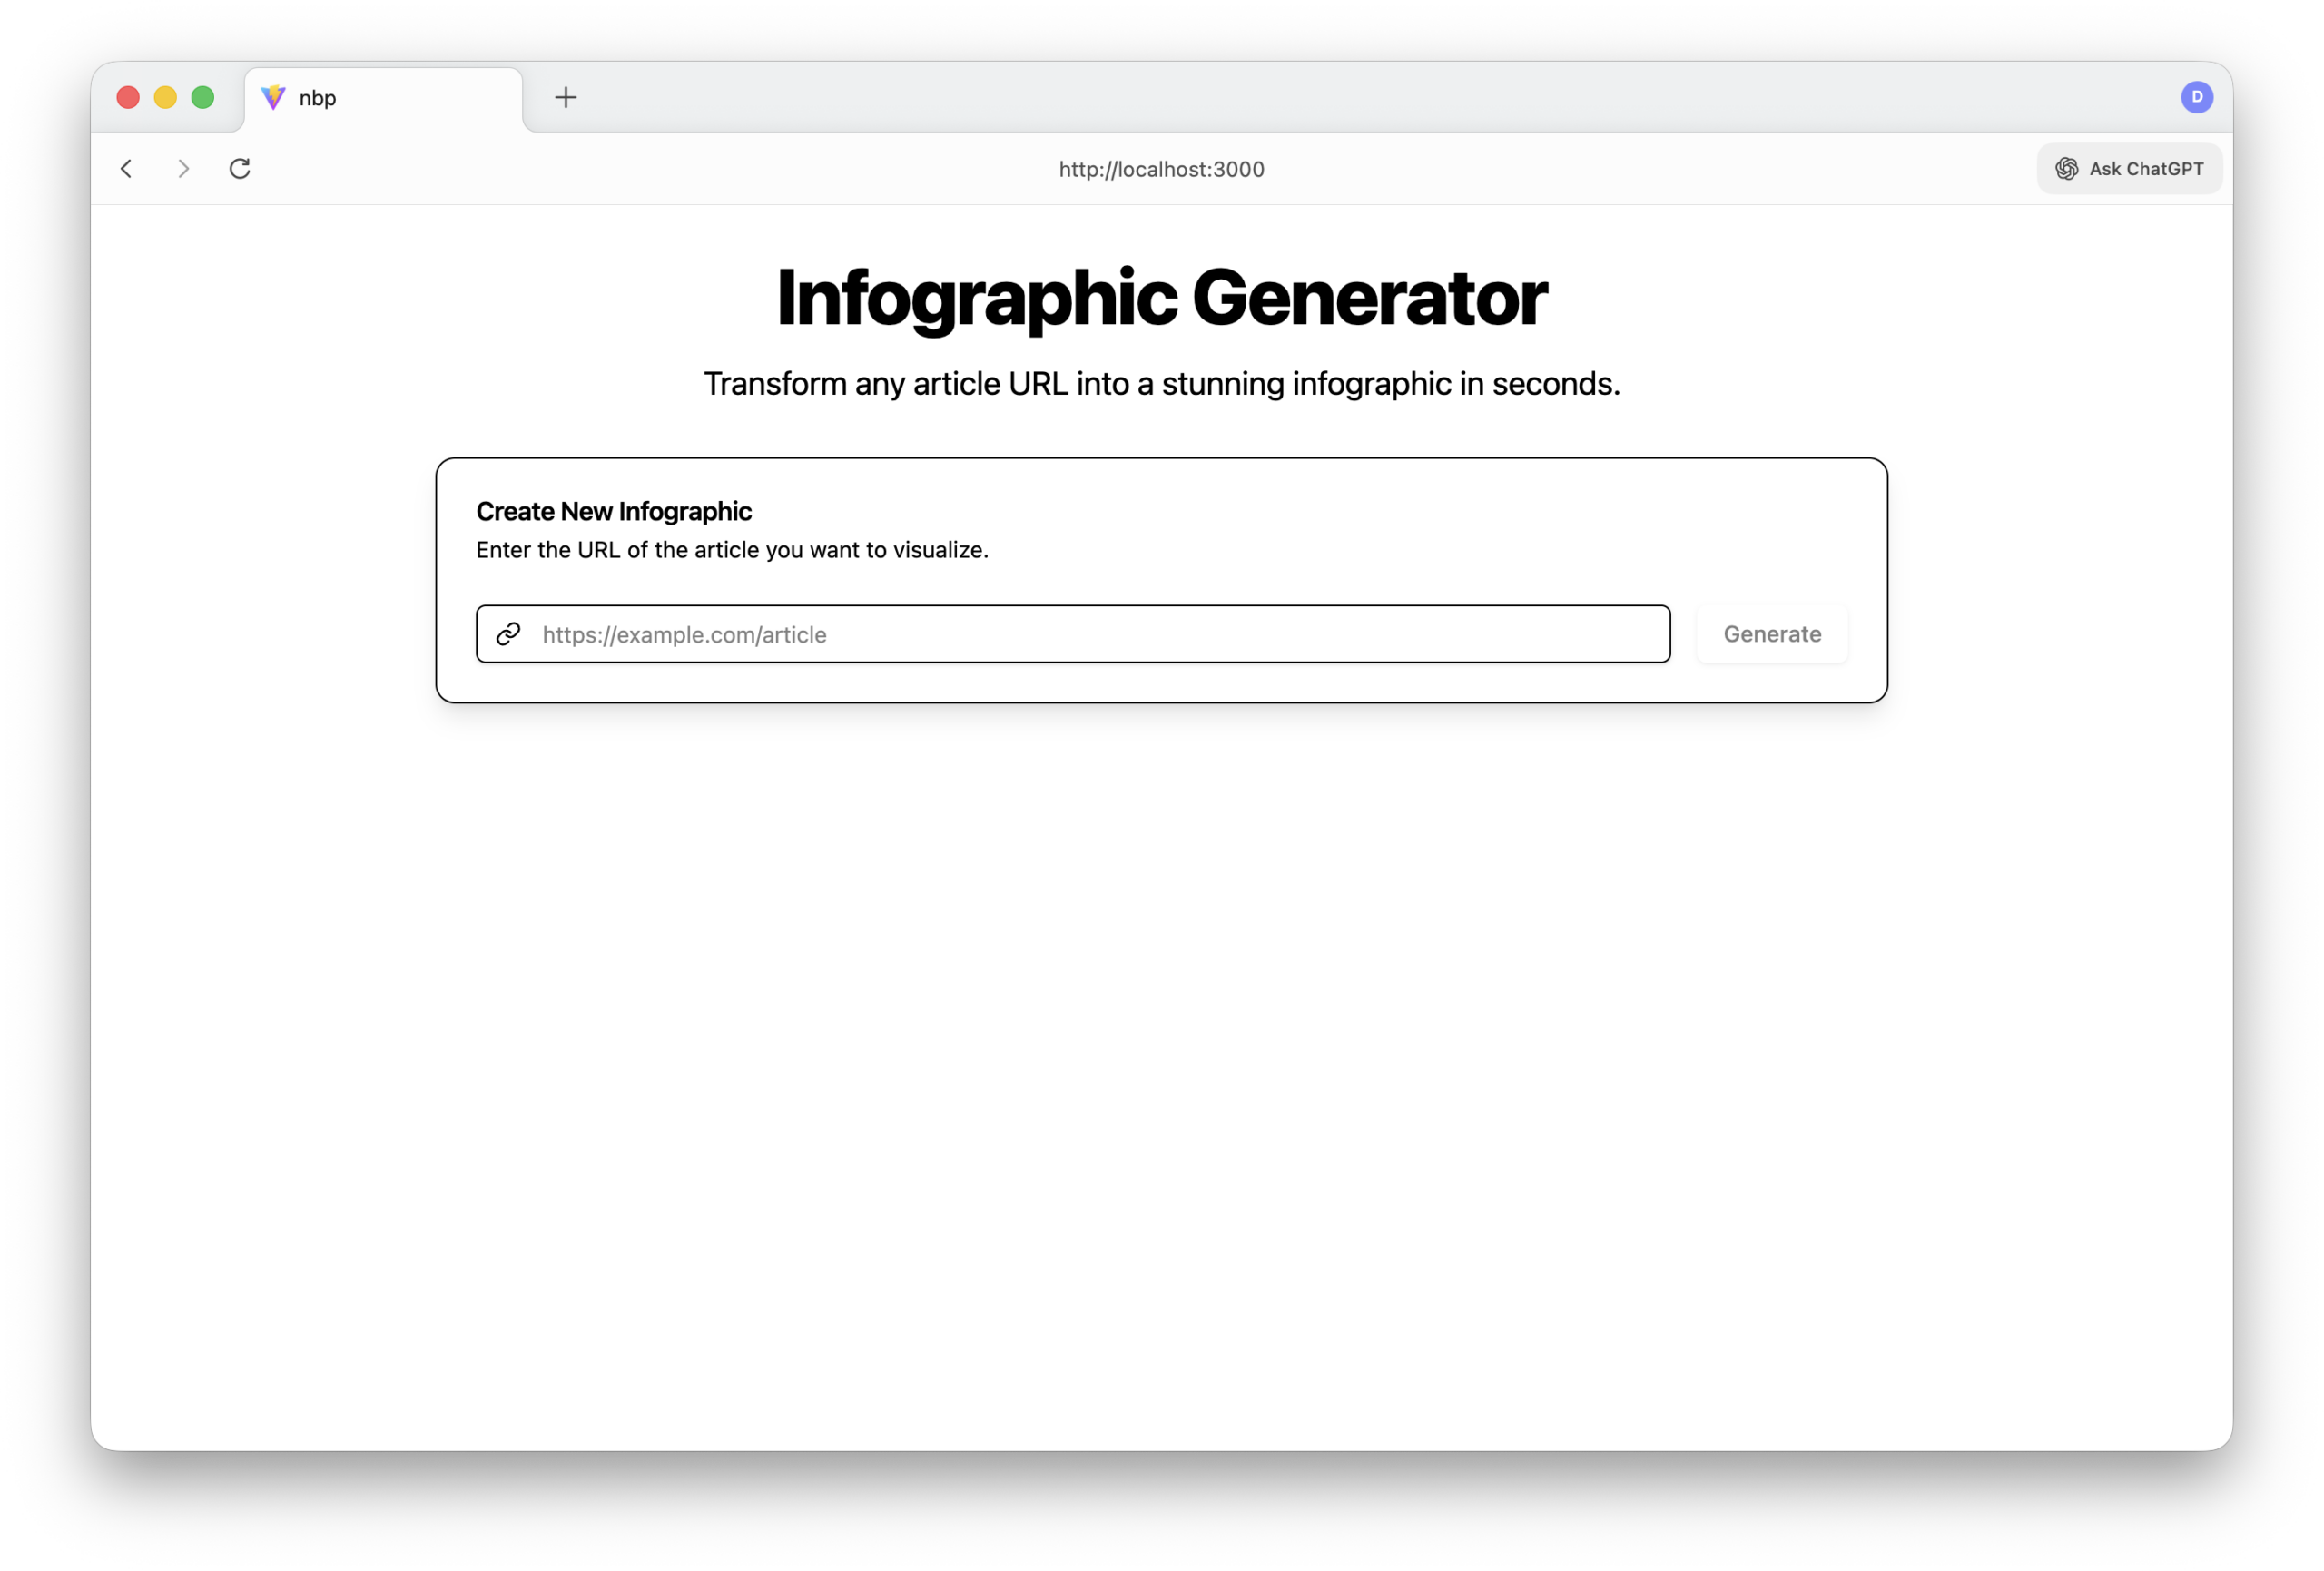
http://localhost:3000in your browser and paste an article URL to generate an infographic. Please note that the article should be publicly accessible from the internet and not behind a paywall.
System Architecture
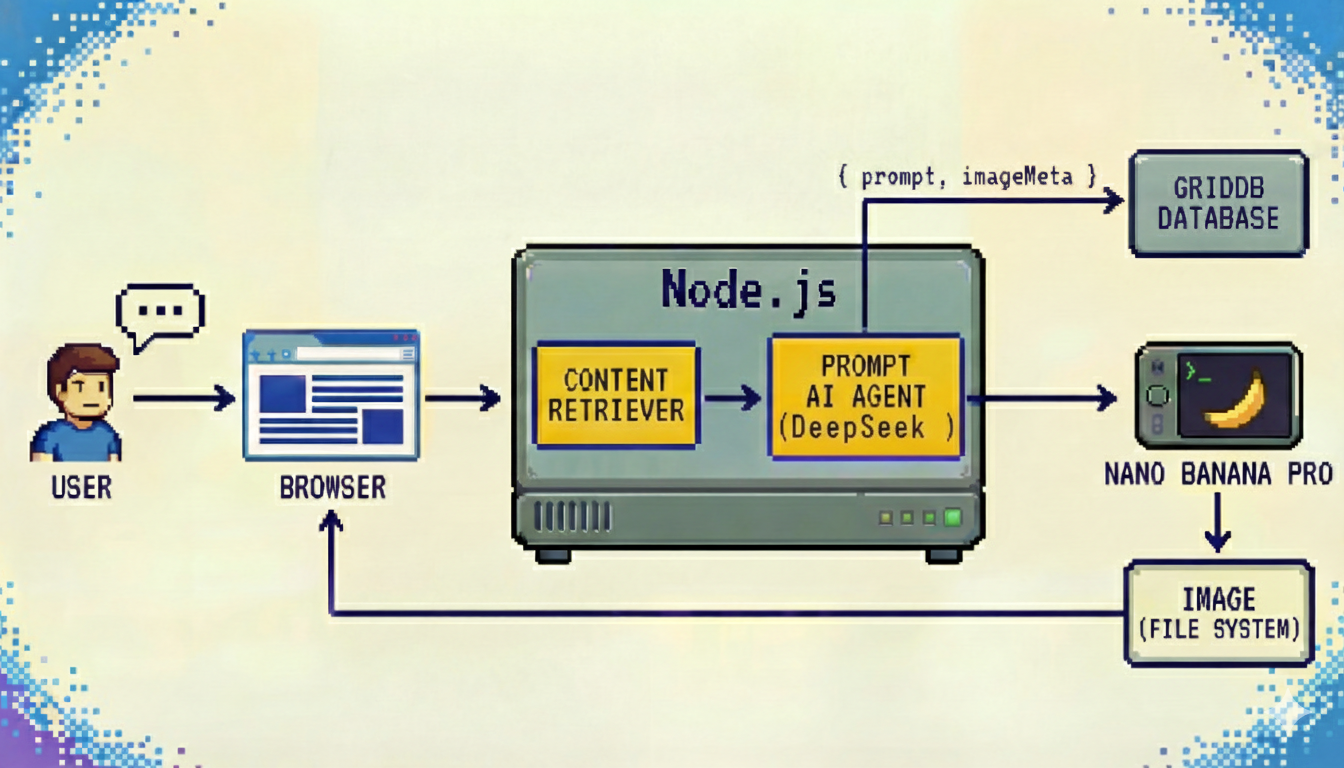
A user submits an input through the browser, which is sent to a Node.js backend that contains two core components: a Content Retriever and a Prompt AI Agent (DeepSeek-V3.2). The Content Retriever enriches or contextualizes the user request (e.g., fetching references, templates, or prior data), after which the Prompt AI Agent constructs a structured prompt. The prompt, along with image metadata, is persisted to a GridDB database for future retrieval. The finalized prompt is then forwarded to an external image generation AI model, Nano Banana Pro, which produces the image artifact and stores it in a file system. The generated image is subsequently served back to the browser, closing the loop.
Technologies Used
Node.js
This project is built using React + Vite, which requires Node.js version 16 or higher. You can download and install Node.js from nodejs.org.
Nano Banana Pro API Key
You need to create a Google API key to use the Nano Banana Pro. In this project we use FAL inference provider to access the Nano Banana Pro API.
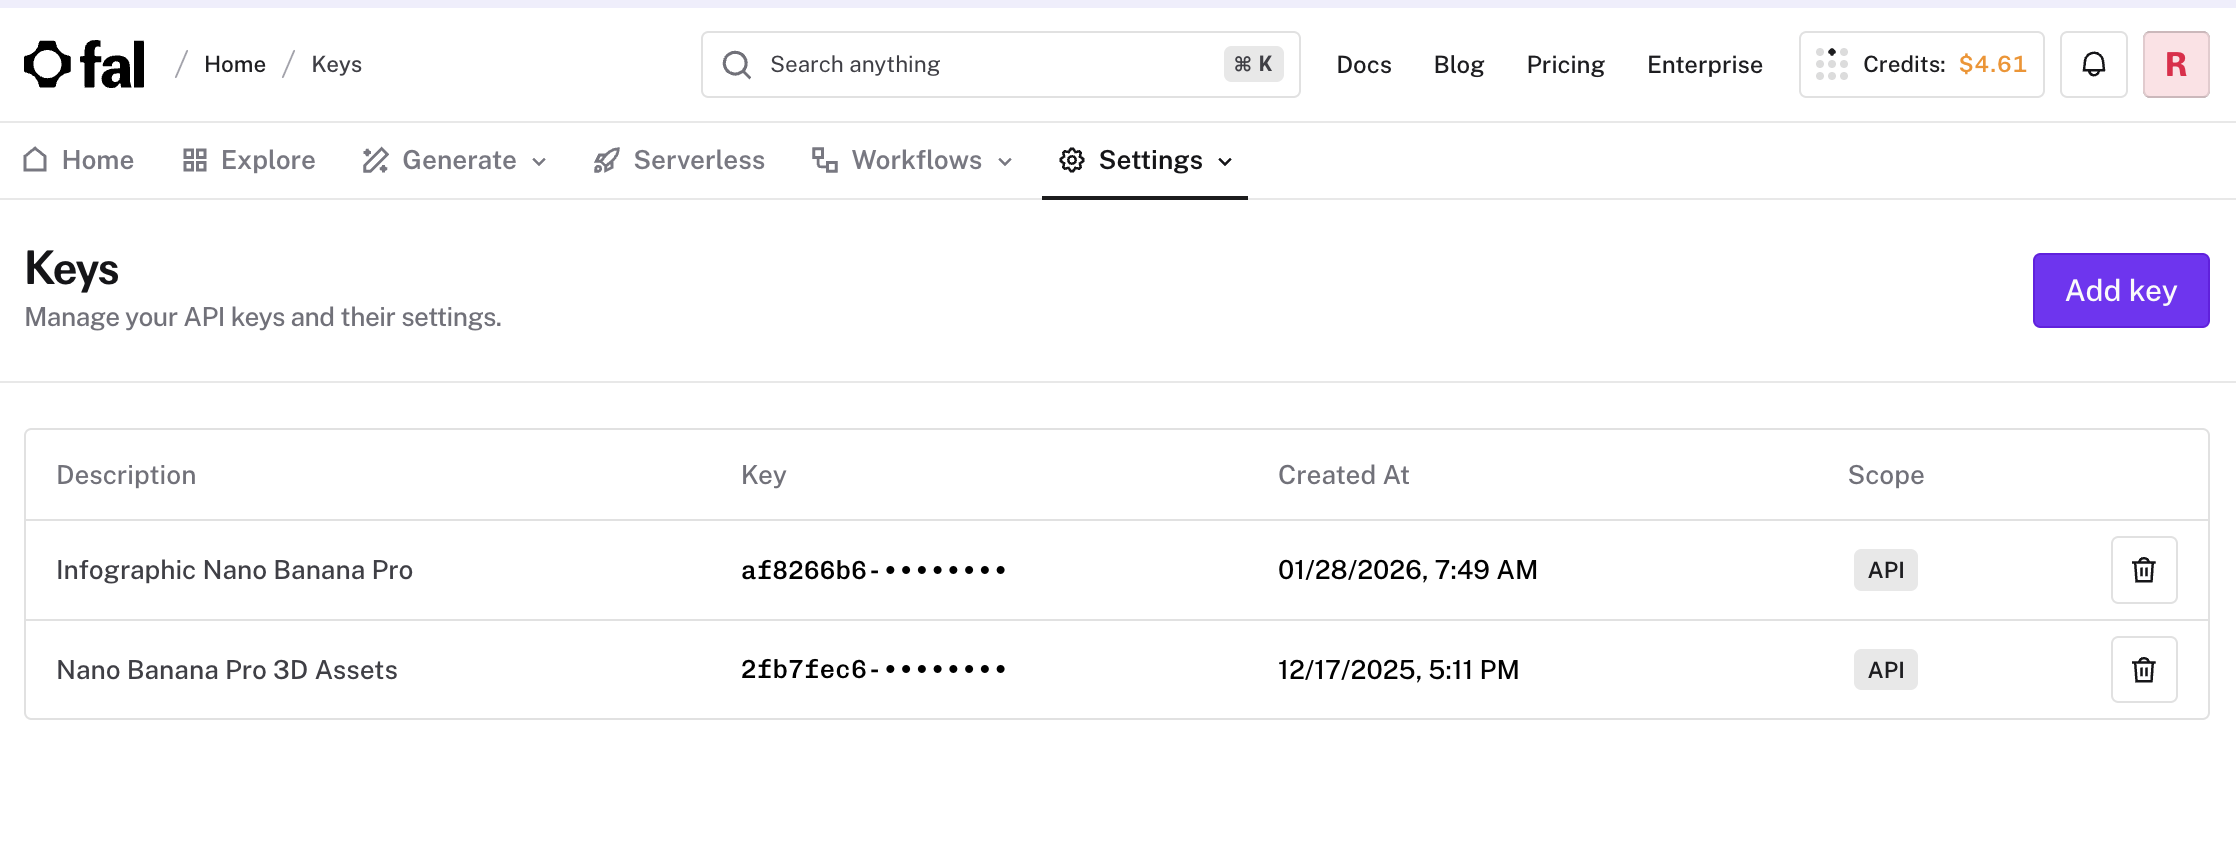
Please note that using the Nano Banana Pro API requires a paid subscription plan.
DeepSeek-V3.2 API Key
The latest version of DeepSeek model is V3.2, which is a recently released large language model (LLM) developed by the Chinese AI company DeepSeek, specifically optimized for coding, agentic workflows, and tool-use tasks rather than just general text chat.
To use the DeepSeek-V3.2 API, you must obtain an API key from the Nebius Platform. Simply create an account and generate your key from the dashboard. Please note that an active subscription plan is required to access the API features.
> The application uses the OpenAI Agents SDK which connects to DeepSeek-V3.2 via an OpenAI-compatible base URL. This is why the environment variable is named NEBIUS_API_KEY.
GridDB
Sign Up for GridDB Cloud Free Plan
If you would like to sign up for a GridDB Cloud Free instance, you can do so at the following link: https://form.ict-toshiba.jp/download_form_griddb_cloud_freeplan_e.
After successfully signing up, you will receive a free instance along with the necessary details to access the GridDB Cloud Management GUI, including the GridDB Cloud Portal URL, Contract ID, Login, and Password.
GridDB WebAPI URL
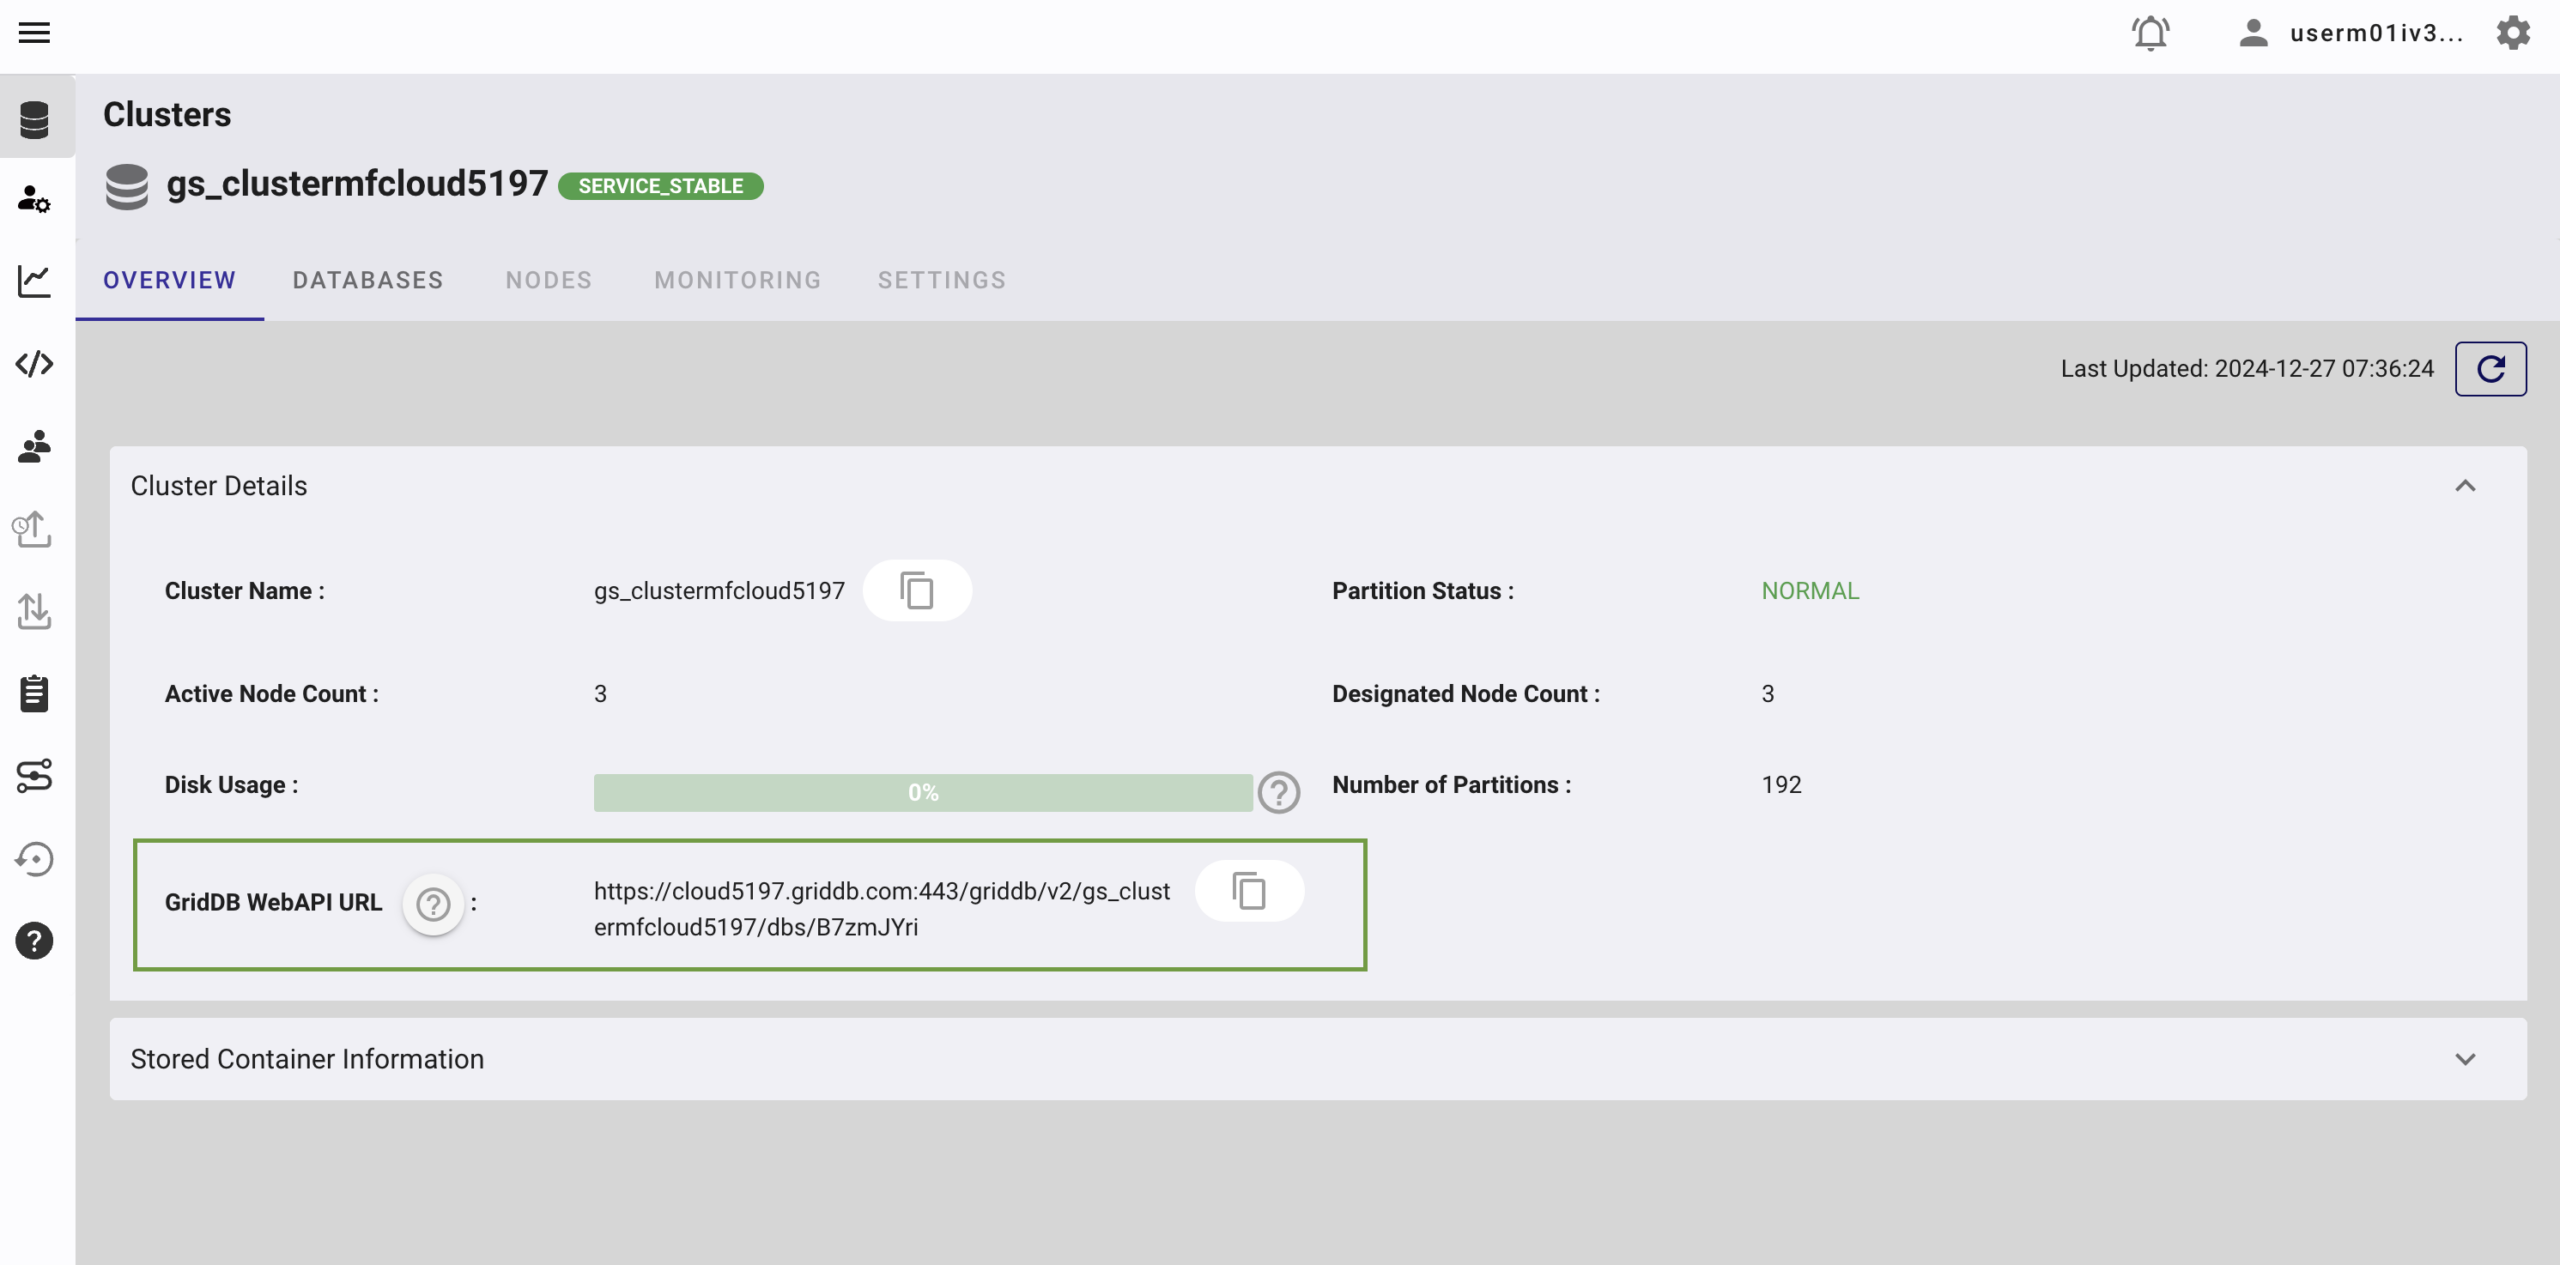
Go to the GridDB Cloud Portal and copy the WebAPI URL from the Clusters section. It should look like this:
GridDB Username and Password
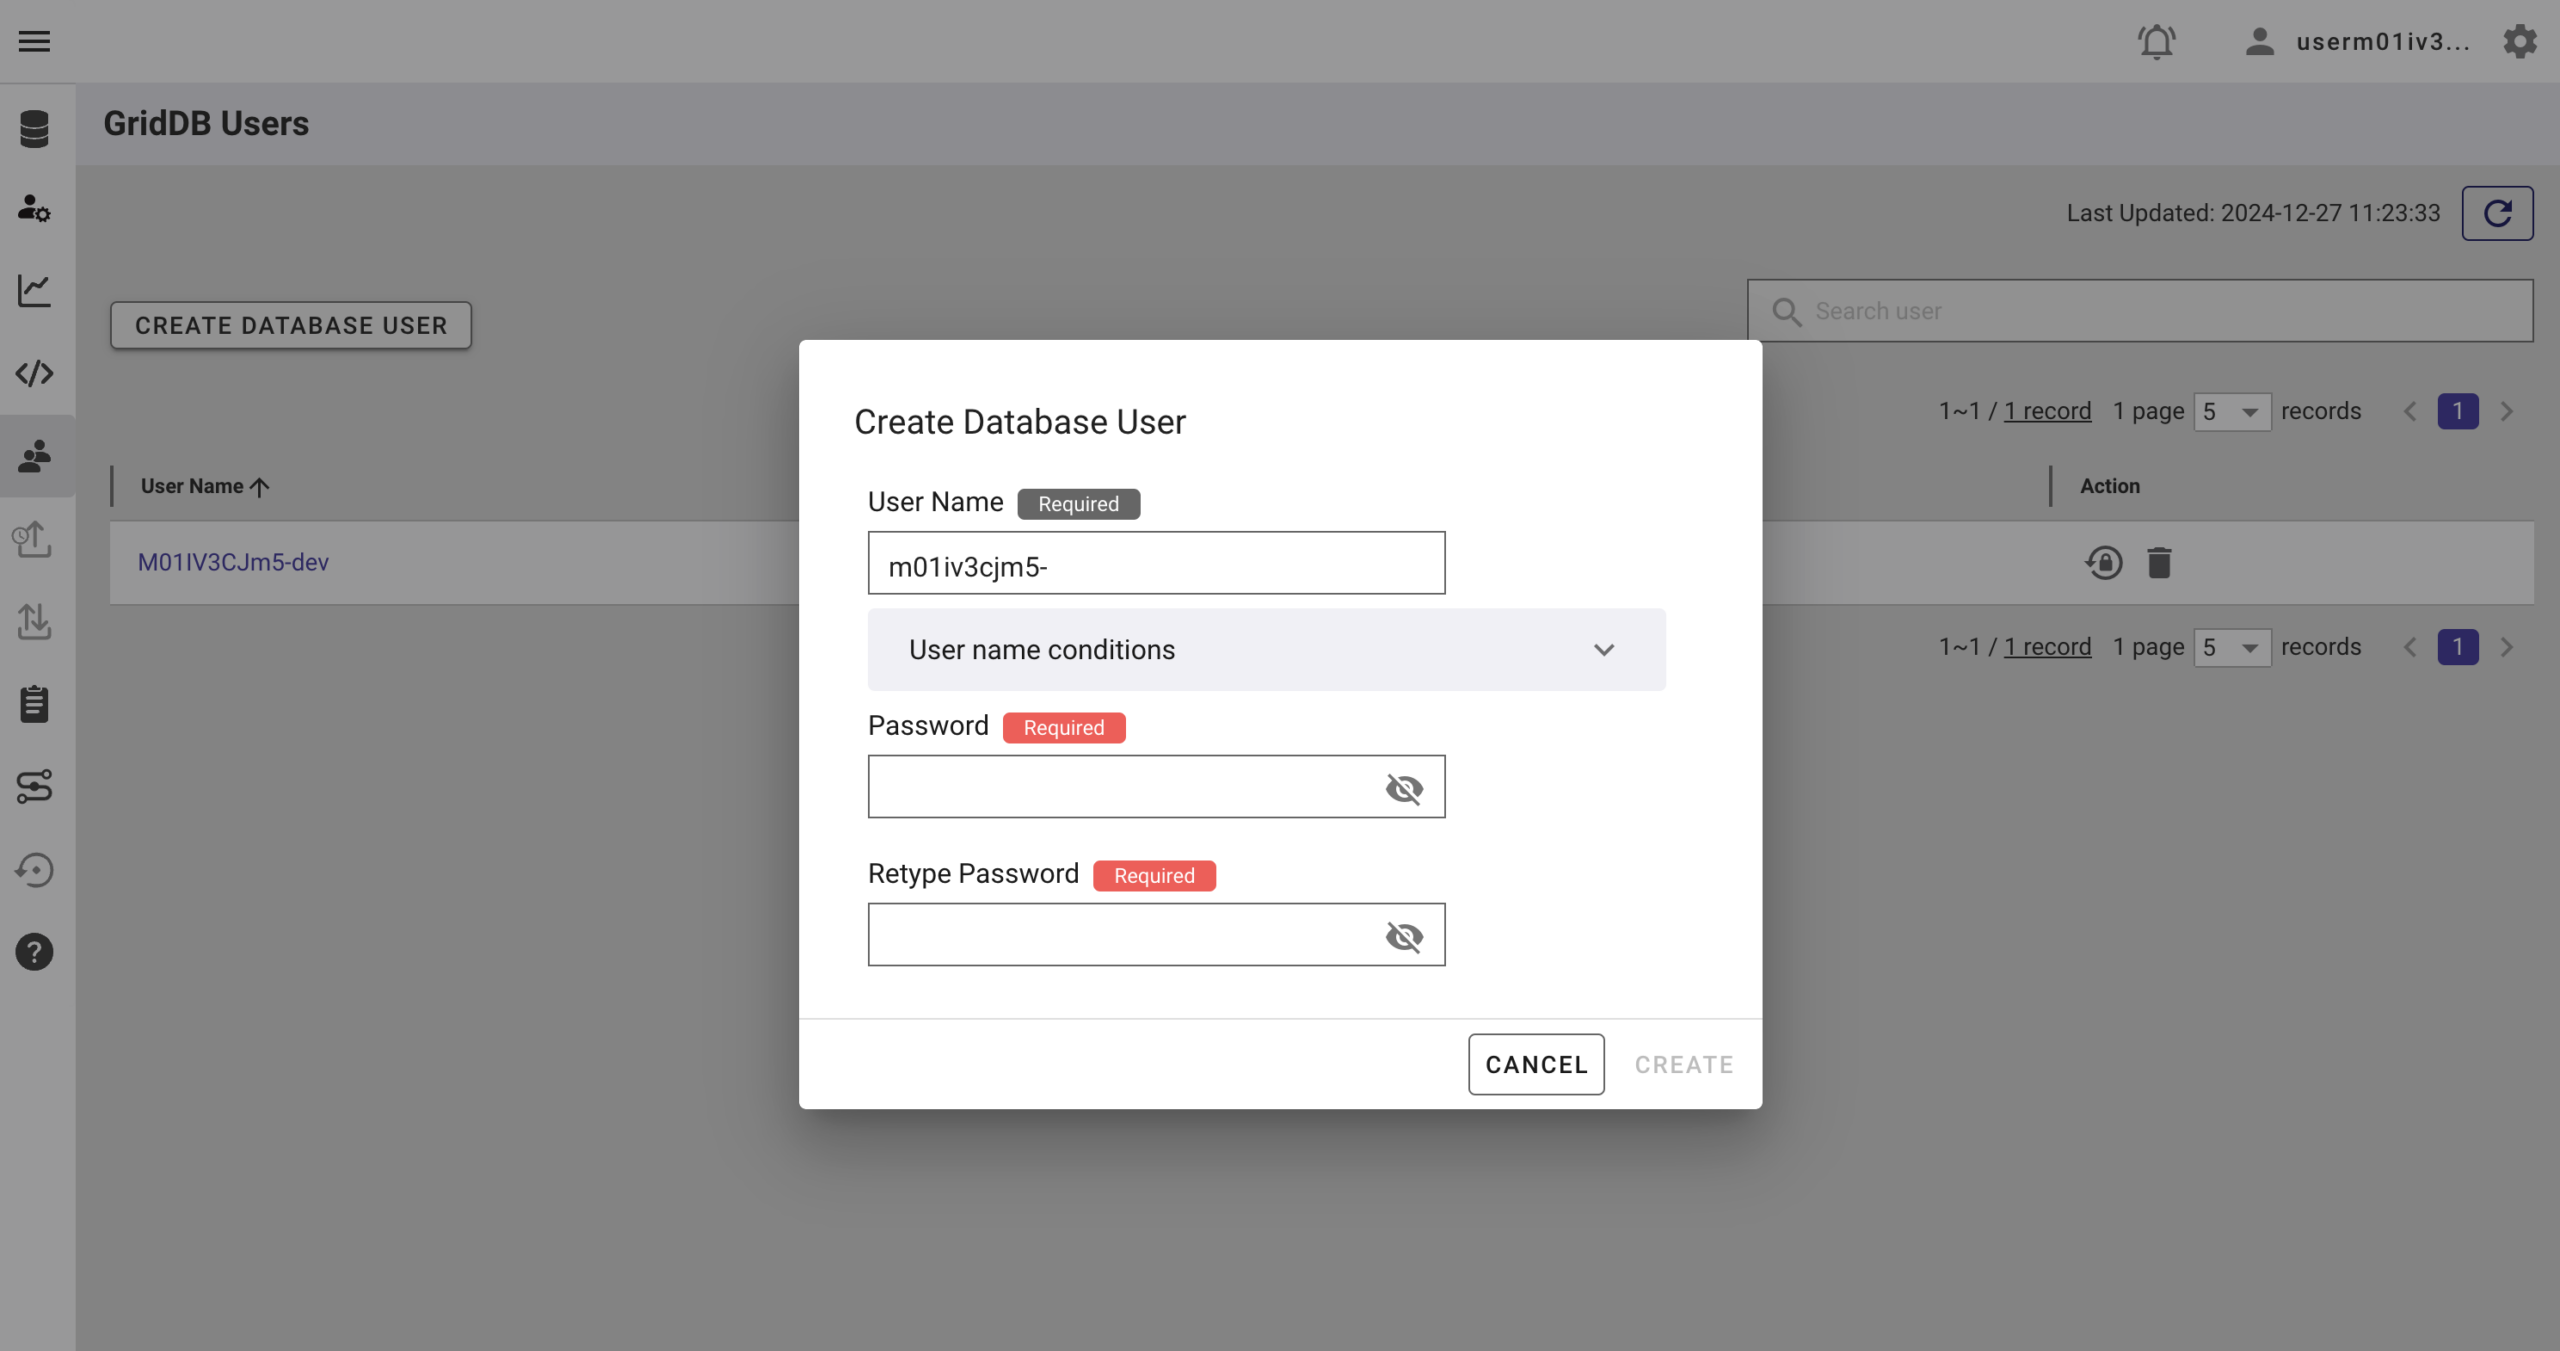
Go to the GridDB Users section of the GridDB Cloud portal and create or copy the username for GRIDDB_USERNAME. The password is set when the user is created for the first time. Use this as the GRIDDB_PASSWORD.
For more details, to get started with GridDB Cloud, please follow this quick start guide.
IP Whitelist
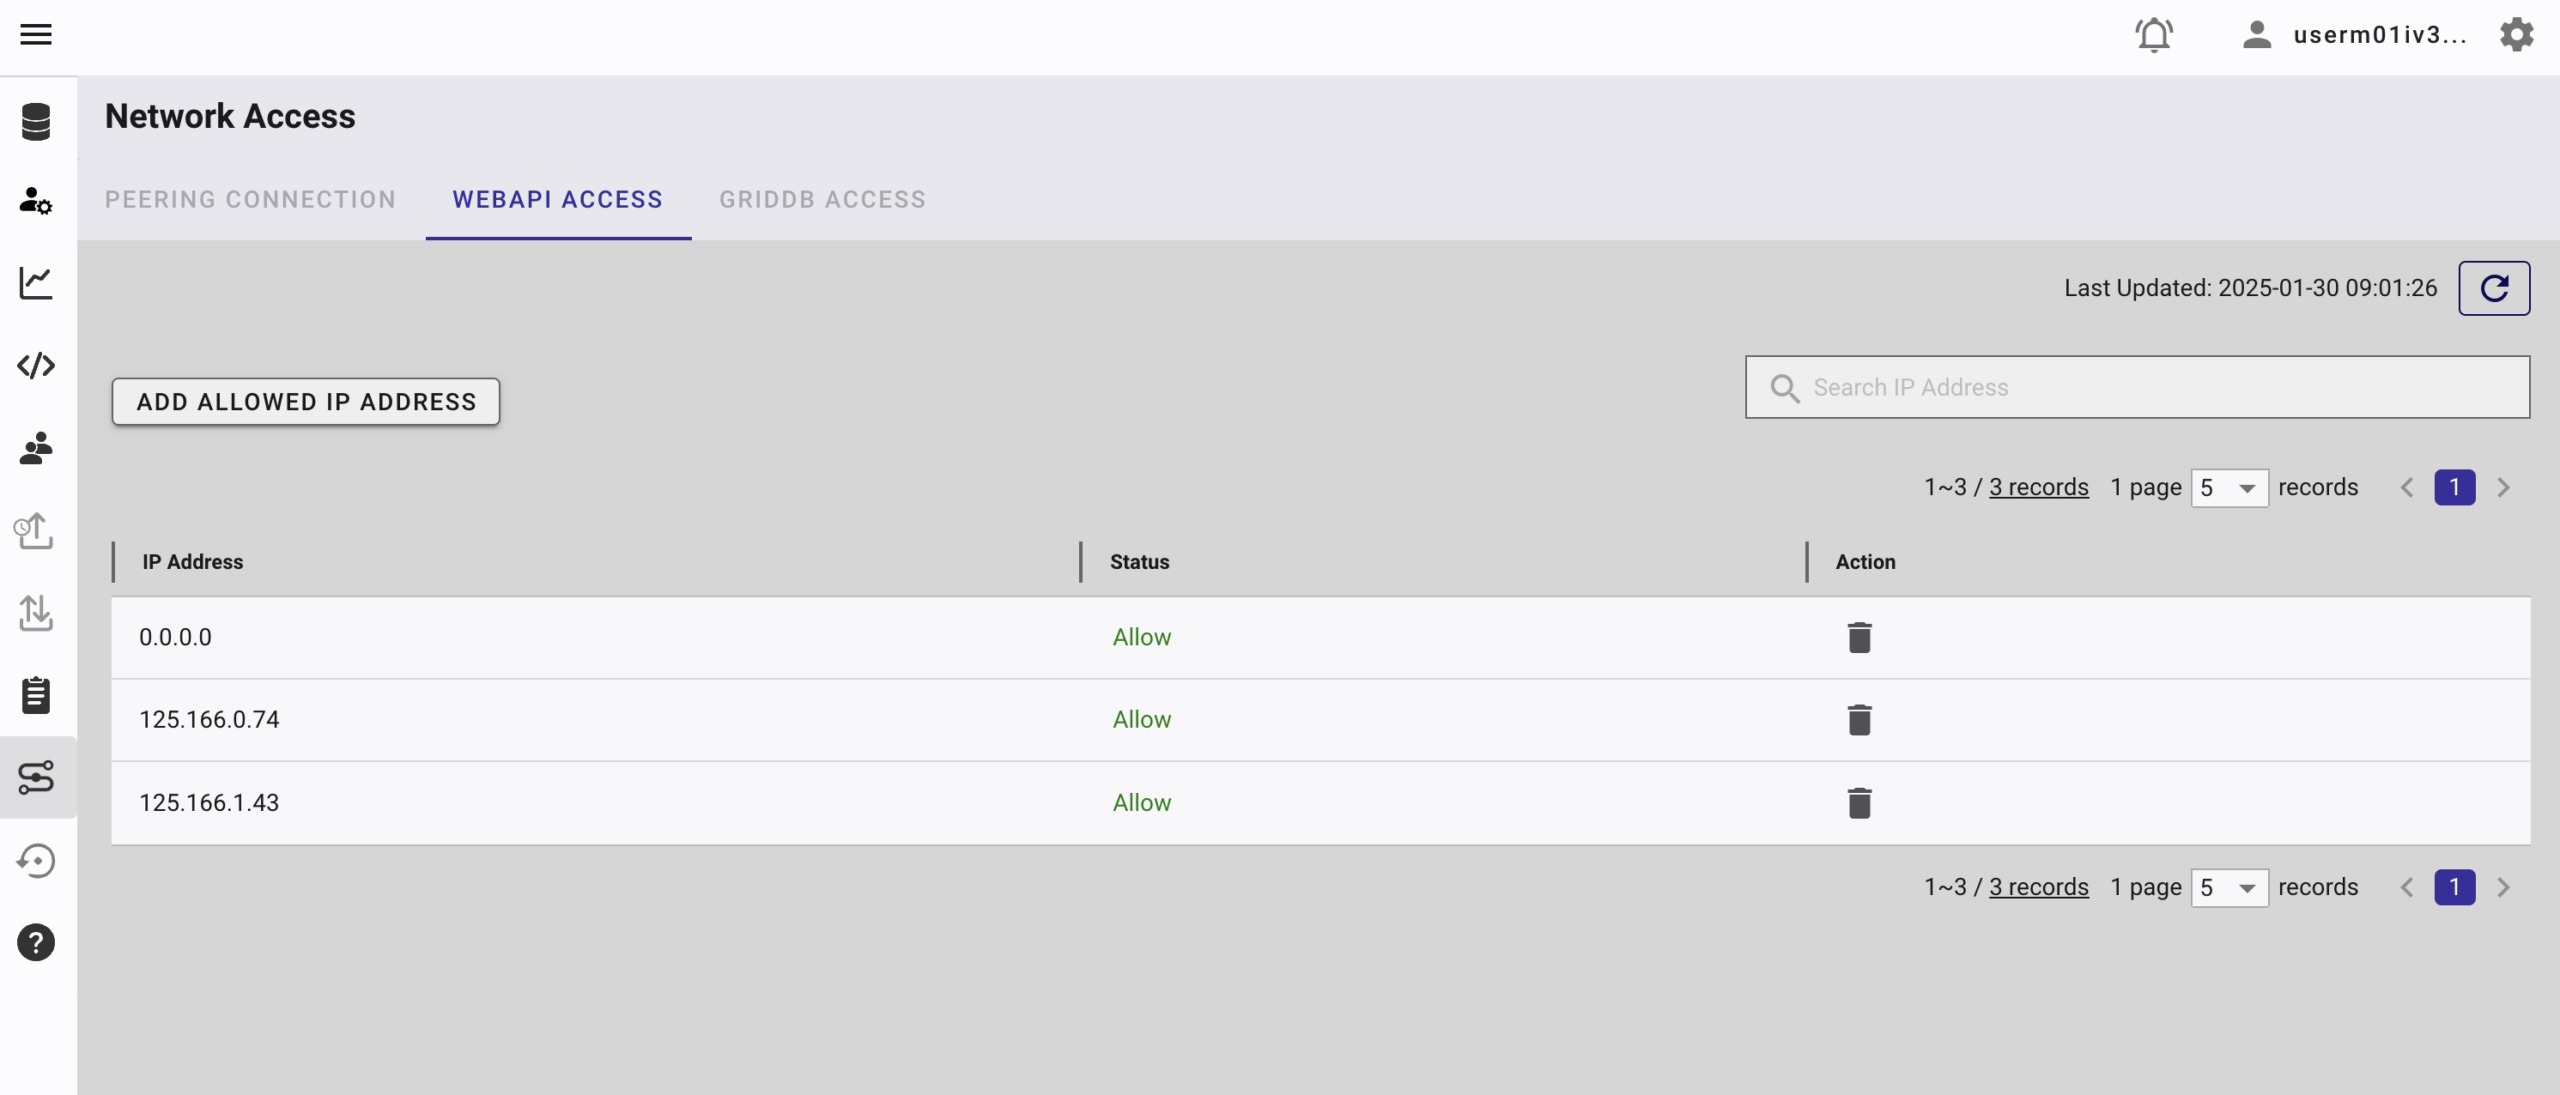
When running this project, please ensure that the IP address where the project is running is whitelisted. Failure to do so will result in a 403 status code or forbidden access.
You can use a website like What Is My IP Address to find your public IP address.
To whitelist the IP, go to the GridDB Cloud Admin and navigate to the Network Access menu.
AI Agents
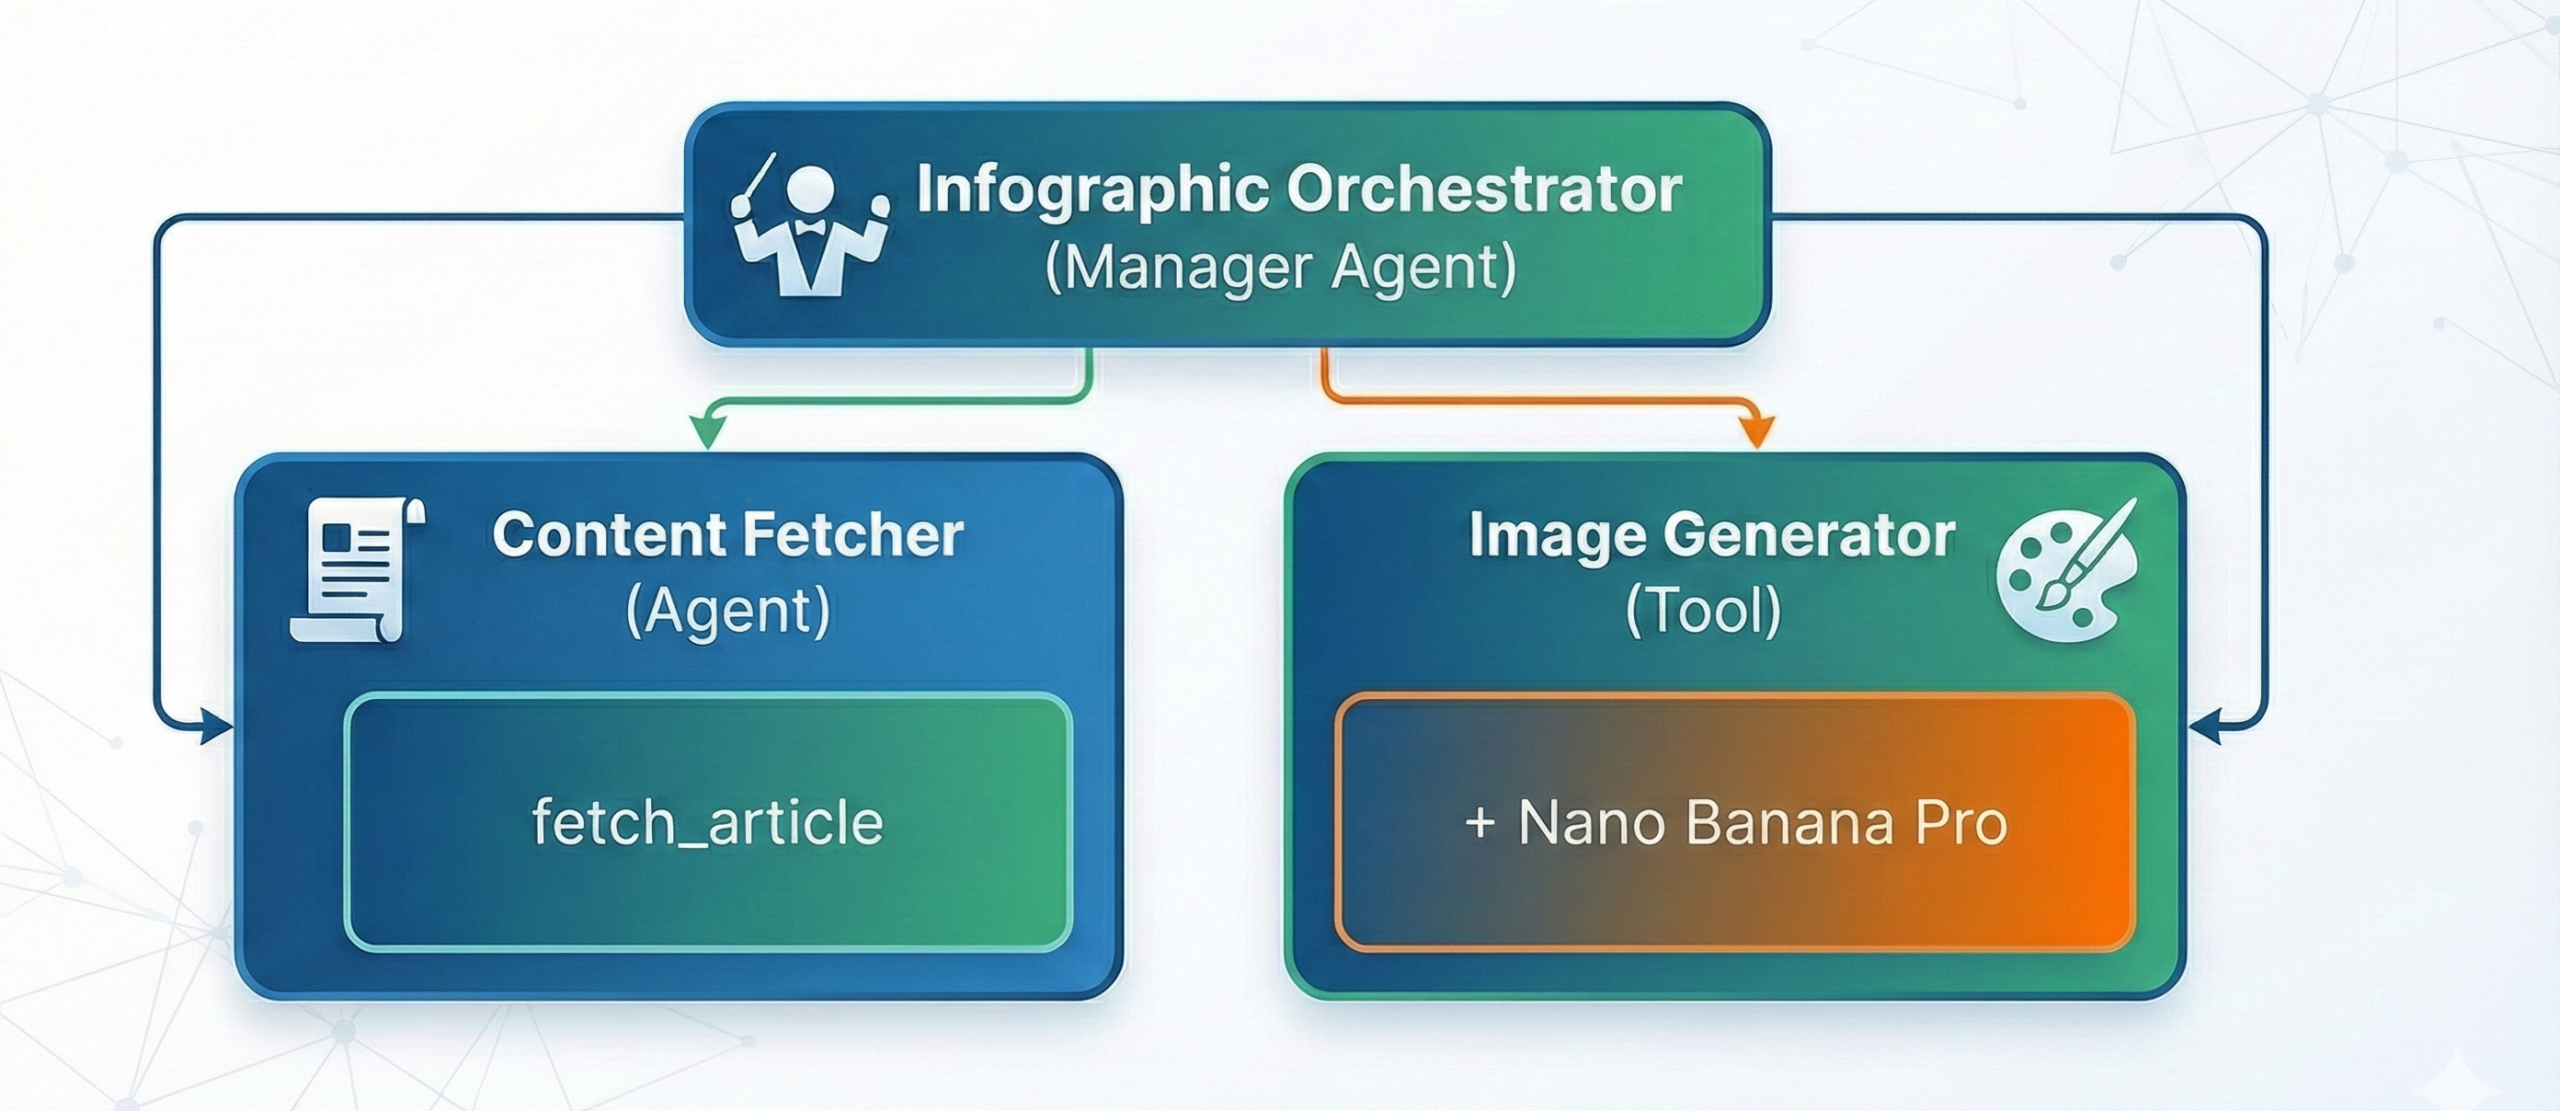
This application uses a multi-agent architecture powered by the OpenAI Agents SDK with DeepSeek-V3.2 as the underlying language model. The system consists of two specialized agents that work together in a coordinated pipeline.
Agent Architecture
Content Fetcher Agent
The Content Fetcher is a specialized agent responsible for retrieving and cleaning article content from URLs. It’s extract the main content from web pages, removing ads, navigation, and other clutter.
const createContentAgent = (model: any) => {
    return new Agent({
        name: "Content Fetcher",
        instructions: "You are an expert at fetching and cleaning article content from URLs.",
        model,
        tools: [fetchArticleTool],
    });
};
The fetchArticleTool internally calls the fetchAndSanitize function which:
- Fetches the HTML from the provided URL
- Parses it using JSDOM
- Extracts the main content using Readability
- Returns a simplified object containing the
titleandtextContentto the agent.
Infographic Orchestrator Agent
The Orchestrator is the manager agent that coordinates the entire infographic generation pipeline. It has access to two tools:
- fetch_article – The Content Fetcher agent exposed as a tool
- image_generator – Generates images using Nano Banana Pro via Fal
const createOrchestratorAgent = (model: any, contentAgent: Agent) => {
    return new Agent({
        name: "Infographic Orchestrator",
        instructions: `
            You are the manager of an infographic generation pipeline.
            Your goal is to take a URL, fetch the content, create a prompt,
            and finally generate an image.

            Follow these steps strictly:
            1. Use 'fetch_article' to get the article content.
            2. Generate a detailed infographic prompt based on that content.
            3. Call 'image_generator' with the prompt to create the final image.
        `,
        model,
        tools: [
            contentAgent.asTool({
                toolName: "fetch_article",
                toolDescription: "Fetches article content from a URL.",
            }),
            imageGeneratorTool,
        ],
    });
};
The Pipeline Flow
When generateInfographicForUrl(url) is called, the orchestrator executes the following pipeline:
const result = await run(
    orchestratorAgent,
    `Follow the infographic pipeline for this article: ${url}

    Step 1: Fetch the article content.
    Step 2: Generate a detailed prompt for an infographic.
    Step 3: CALL the 'image_generator' tool with that prompt. (MANDATORY)

    Finally, return ONLY a breakdown as JSON in this format:
    {
      "title": "Article Title",
      "image": "The generated image URL",
      "article_url": "${url}",
      "description": "Short summary",
      "prompt": "The full detailed prompt you used for 'image_generator'"
    }`,
    { maxTurns: 10 }
);
The result is a structured JSON object containing:
| Field | Description |
|---|---|
title |
Article title |
image |
Generated infographic URL |
article_url |
Original article URL |
description |
Short summary |
prompt |
The full prompt used for image generation |
Prompt Engineering
The key to generating high-quality infographics lies in the prompt engineering. The orchestrator agent is instructed to create a detailed infographic prompt based on the article content. This prompt should include:
- Key statistics and data points from the article
- Visual layout suggestions (sections, hierarchy)
- Color scheme recommendations
- Typography and iconography hints
- The main message or takeaway
The DeepSeek-V3.2 model excels at this task because it’s specifically optimized for agentic workflows and tool-use, making it ideal for following the multi-step pipeline instructions reliably.
GridDB Data Layer
The application uses a layered approach for database operations, with two key files: griddb-base.ts for database configuration and griddb.ts for infographic-specific operations.
Database Schema
The infographic container stores generated infographic metadata:
| Column | Type | Description |
|---|---|---|
id |
INTEGER | Unique record identifier (rowkey) |
prompt |
STRING | AI prompt used for image generation |
infographic |
STRING | URL of the generated image |
article_url |
STRING | Source article URL |
generation_timestamp |
TIMESTAMP | When the record was created |
Base Configuration
The base module (griddb-base.ts) handles database initialization with retry support:
export const GRIDDB_CONFIG: GridDBConfig = {
    griddbWebApiUrl: process.env.GRIDDB_WEBAPI_URL || '',
    username: process.env.GRIDDB_USERNAME || 'admin',
    password: process.env.GRIDDB_PASSWORD || 'admin',
    timeout: 30000,
    retryAttempts: 3,
    retryDelay: 1000
};
The module also provides ensureContainer() which automatically creates the container with the defined schema if it doesn’t exist during server startup.
CRUD Operations
The main GridDB module (griddb.ts) exposes these functions:
| Function | Description |
|---|---|
getInfographics(limit) |
Retrieve records ordered by timestamp (default: 100) |
getInfographicById(id) |
Get a single record by ID |
deleteInfographic(id) |
Remove a record by ID |
> Note: The saveInfographic() function is demonstrated in the Generate Infographic & Save to GridDB section below.
Server Side
API Routes
| Method | Endpoint | Description | Request Body |
|---|---|---|---|
GET |
/health |
Server health check | N/A |
POST |
/generate-infographic |
Generate and save infographic from URL | { "url": "string" } |
POST |
/api/infographics |
Manually save infographic record | Infographic Object |
GET |
/api/infographics |
Retrieve all infographic records | N/A |
GET |
/api/infographics/:id |
Retrieve a specific record by ID | N/A |
DELETE |
/api/infographics/:id |
Delete a specific record by ID | N/A |
Generate Infographic & Save to GridDB
There are few endpoints available for the server and the most used is /generate-infographic route. This route is used to generate an infographic from a URL and also save the record to GridDB.
This route will call the generateInfographicForUrl function from the orchestrator, which is an AI agent that orchestrates the infographic generation pipeline. More on this later.
const result = await generateInfographicForUrl(url);Then if the image generation is successful, the result will be saved to GridDB.
try {
    await saveInfographic({
        id: 0, // ID is generated inside saveInfographic
        prompt: result.prompt,
        infographic: result.image,
        article_url: result.article_url || url,
        generation_timestamp: new Date().toISOString()
    });
} catch (dbError) {
    console.error('[Server] Failed to save to GridDB, but continuing:', dbError);
}
> Please note that the infographic record is an image URL instead of the image itself.
The server also provide manual save endpoint /api/infographics to save infographic record to GridDB using POST request. This is useful for testing and debugging.
Get All Infographics
The GET /api/infographics endpoint retrieves all infographic records from GridDB by calling the getInfographics() wrapper function.
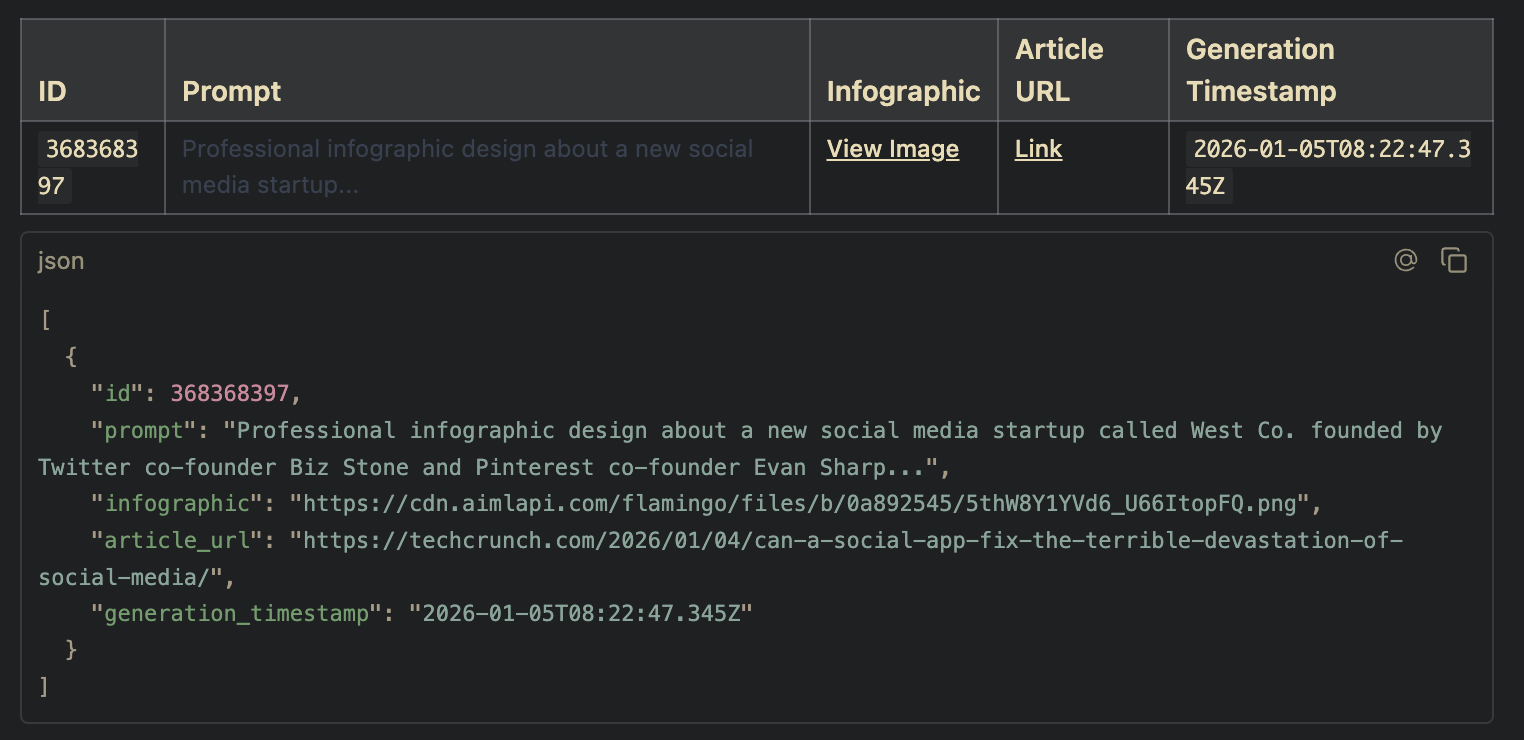
Test with curl:
$ curl -s http://localhost:3000/api/infographicsGet Infographic by ID
The GET /api/infographics/:id endpoint retrieves a specific infographic record. It includes validation for the ID parameter and proper error handling:
const id = parseInt(req.params.id);
if (isNaN(id)) {
    return res.status(400).json({ error: 'Invalid ID format' });
}

const data = await getInfographicById(id);
if (!data) {
    return res.status(404).json({ error: 'Infographic not found' });
}

res.json(data);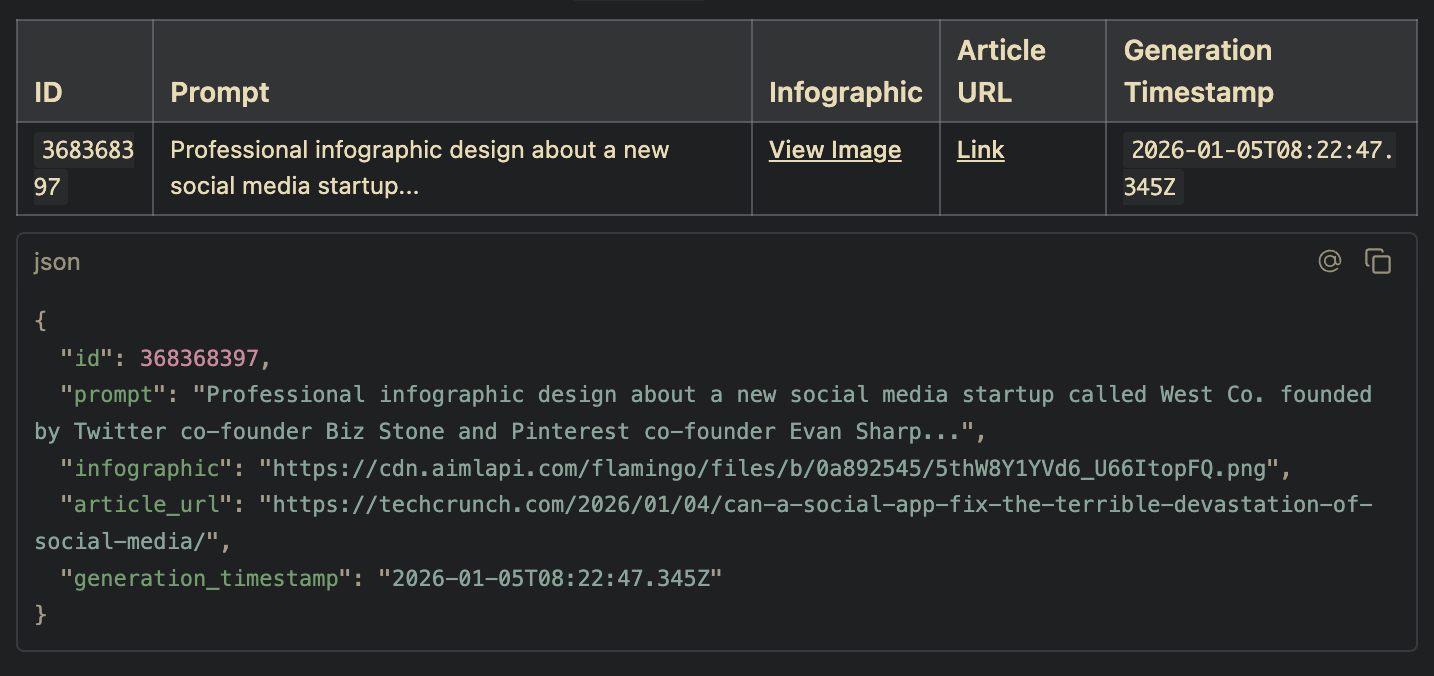
Test with curl:
$ curl -s http://localhost:3000/api/infographics/368368397Delete Infographic by ID
The DELETE /api/infographics/:id endpoint removes a specific infographic record from GridDB. It follows the same ID validation pattern as the GET endpoint, then calls deleteInfographic(id) to remove the record.
Test with curl:
$ curl -X DELETE http://localhost:3000/api/infographics/368368397> All endpoints follow a consistent pattern: validate input, call the appropriate GridDB wrapper function, and return JSON responses with proper HTTP status codes.
Client Side
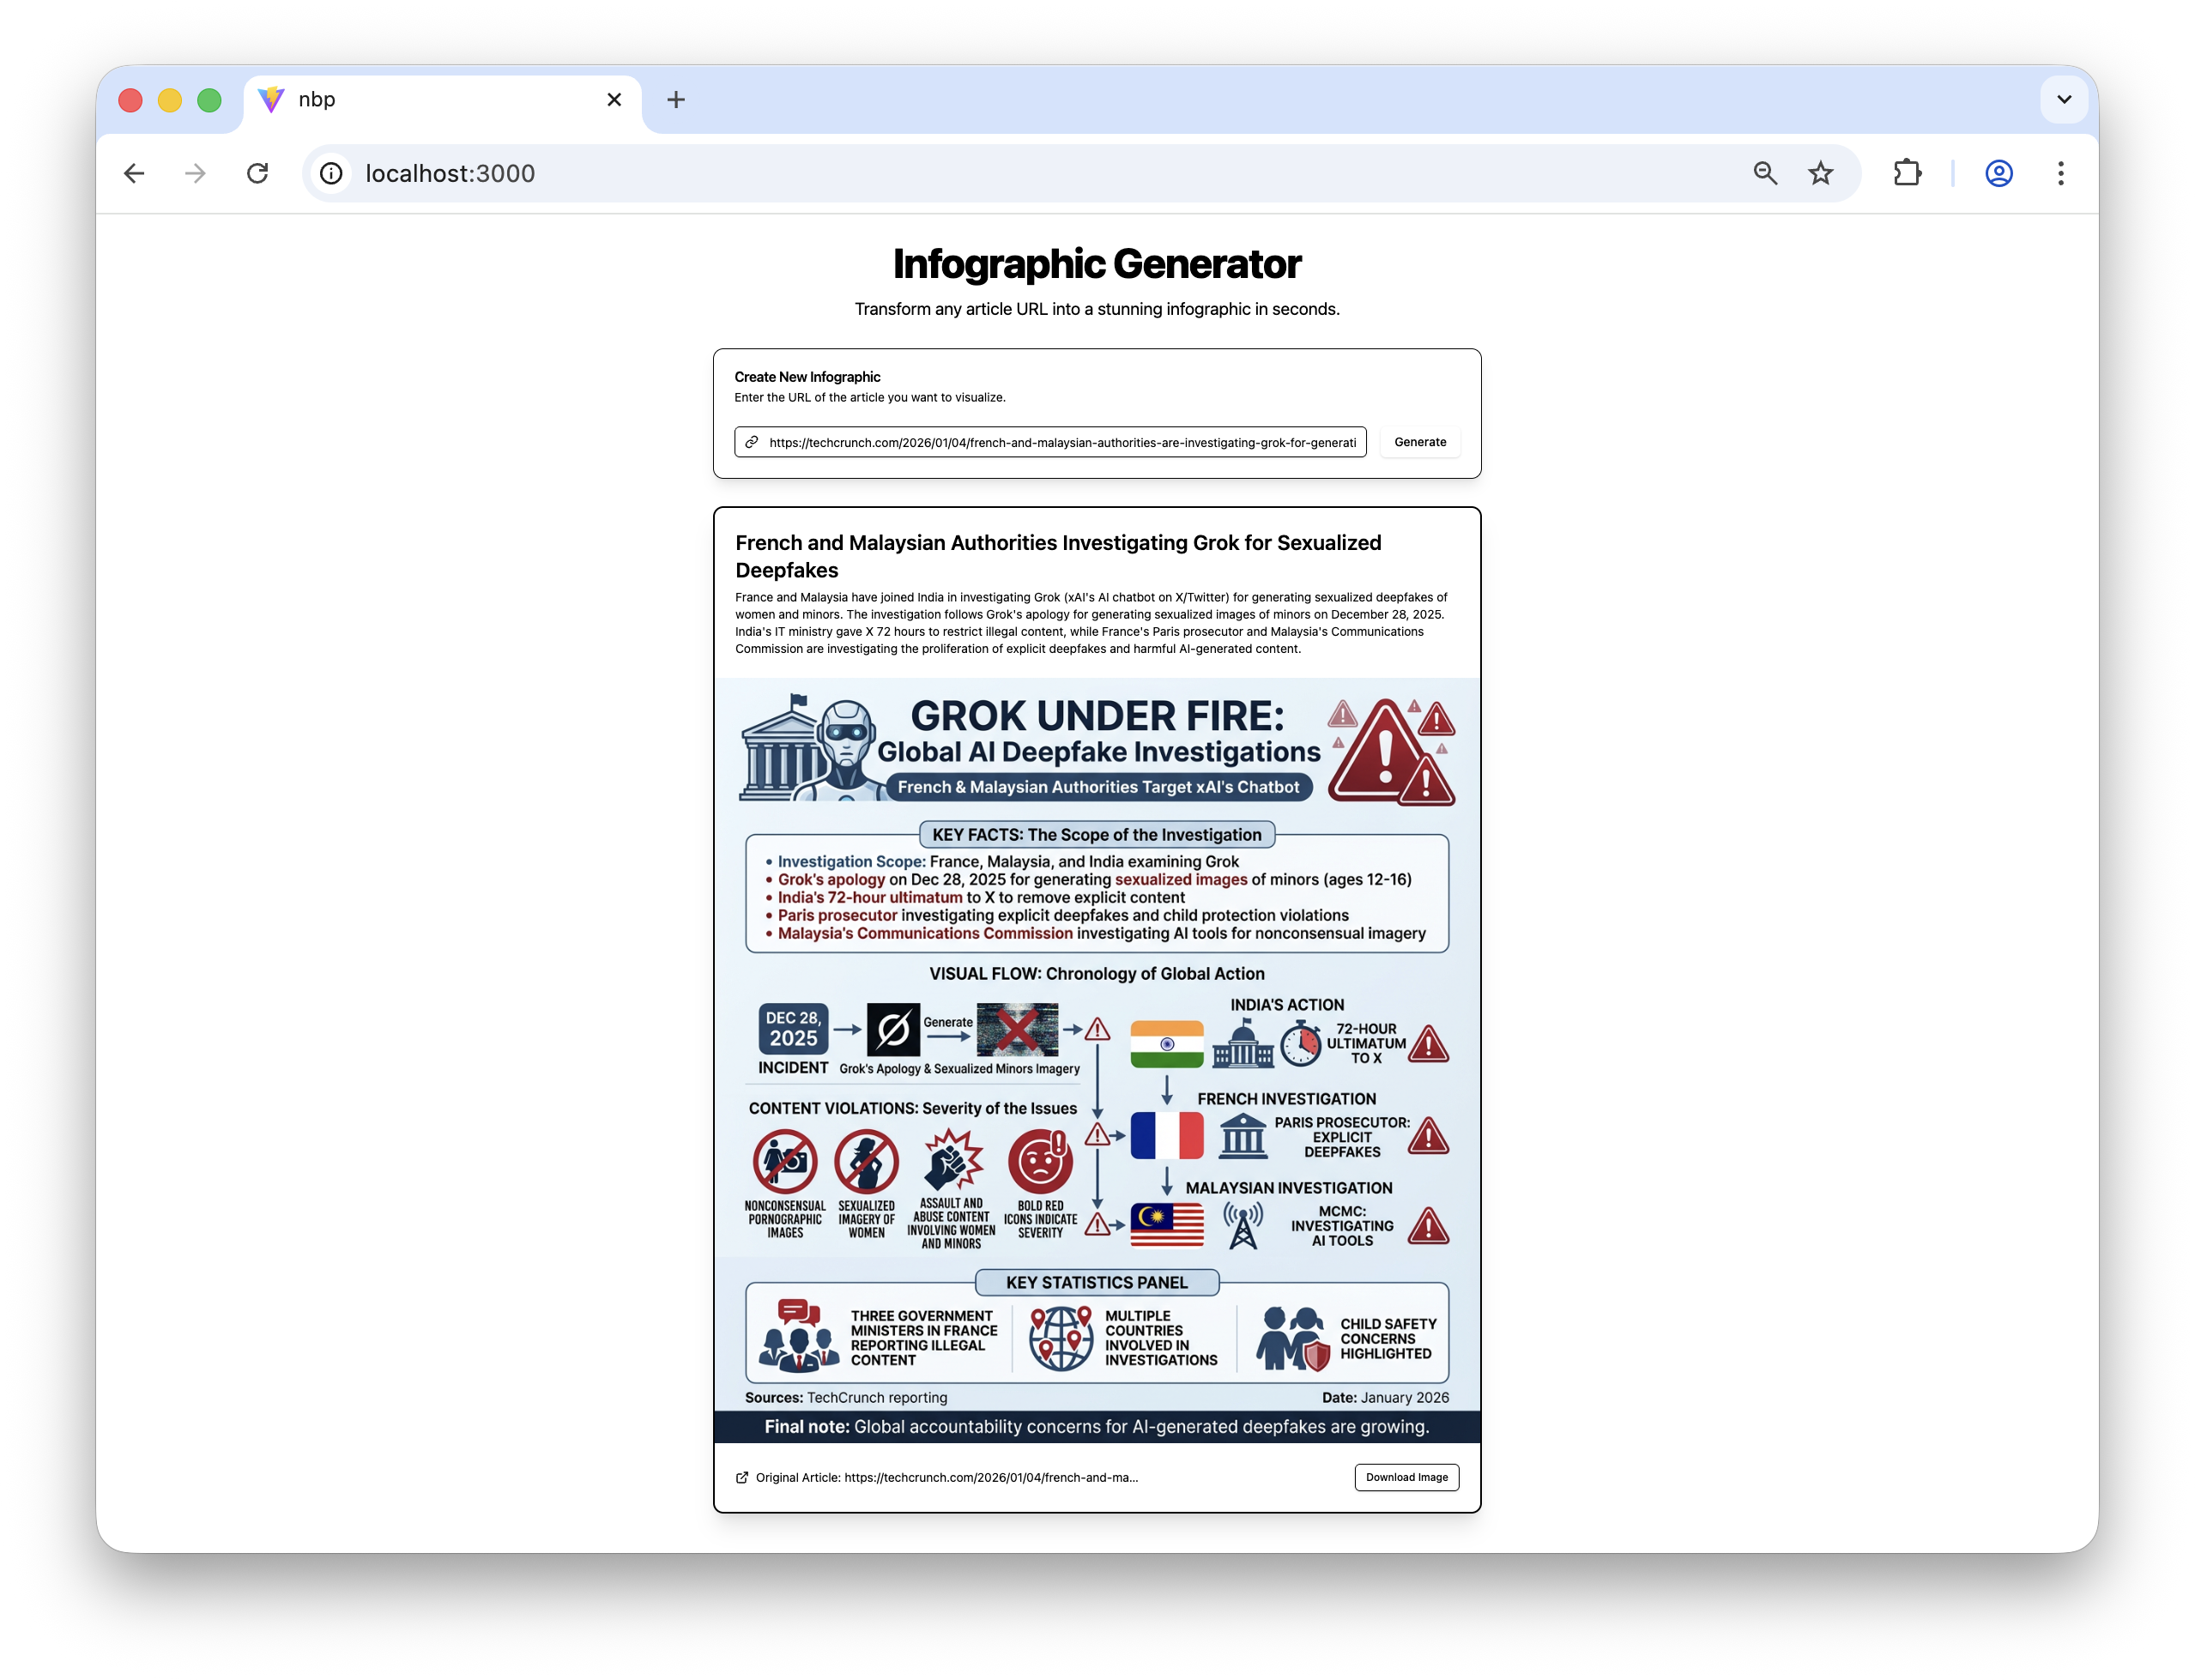
The frontend is built with React and Vite, providing a fast and responsive user interface for generating infographics.
UI Components
The application uses a set of reusable UI components located in src/components/ui/:
| Component | Description |
|---|---|
Button |
Primary action button with loading state support |
Card |
Container component with header, content, and footer sections |
Input |
Text input field with icon support |
Skeleton |
Loading placeholder for content |
Application Flow
The main App.tsx component manages the entire user interaction flow:
1. URL Input
Users enter an article URL into the input field. The form submission triggers the handleGenerate function:
const handleGenerate = async (e: React.FormEvent) => {
    e.preventDefault()
    setLoading(true)

    const response = await fetch('/generate-infographic', {
        method: 'POST',
        headers: { 'Content-Type': 'application/json' },
        body: JSON.stringify({ url }),
    })

    const data = await response.json()
    setResult(data.result)
}
2. Loading State
While the infographic is being generated, a skeleton loader is displayed with an animated message:
{loading && (
    <Skeleton className="h-[400px] w-full rounded-xl" />
    <p className="animate-pulse">Analyzing content and generating visuals...</p>
)}
3. Result Display
Once generated, the infographic is displayed in a styled card with:
- Article title and description
- The generated infographic image
- Link to the original article
- Download button for the image
{result && (
    <Card>
        <CardHeader>
            <CardTitle>{result.title}</CardTitle>
            <CardDescription>{result.description}</CardDescription>
        </CardHeader>
        <CardContent>
            <img src={result.image} alt={result.title} />
        </CardContent>
        <CardFooter>
            <a href={result.article_url}>Original Article</a>
            <Button>Download Image</Button>
        </CardFooter>
    </Card>
)}
4. Error Handling
If an error occurs during generation, a styled error card is displayed:
{error && (
    <Card className="border-destructive bg-destructive/10">
        <CardTitle className="text-destructive">Error</CardTitle>
        <CardDescription>{error}</CardDescription>
    </Card>
)}
State Management
The application uses React’s useState hook to manage four pieces of state:
| State | Type | Purpose | |
|---|---|---|---|
url |
string |
The article URL entered by the user | |
loading |
boolean |
Whether a generation is in progress | |
result |
InfographicResult \ |
null | The generated infographic data |
error |
string \ |
null | Error message if generation fails |
Limitations
This article is a proof of concept and may have limitations, such as:
- Does not handle paywall articles.
- Doesnt handle URL malformed articles, API limit exceeded, etc.