
Introduction
In large factories, accidents usually do not happen suddenly. They often begin with small changes in machine behavior and travel from one machine to another. For example, if a boiler becomes slightly hotter, it may later cause vibration in another machine connected to the same process.
The problem isn’t a lack of sensors, most factories have thousands of them. The real problem is that these sensors don’t talk to each other. Most systems only look at one machine at a time. They miss the “connection” between a hot boiler and a vibrating crusher.
Here, we didn’t just build a dashboard to show numbers. We built an Industrial Safety Layer that “connects the dots.” By using GridDB, the system can track how machine conditions change across the factory and identify risks early.
Why Time-Series Databases Matter for Industrial IoT
Imagine you are looking at a machine’s temperature and it shows 90°C. Is that a problem?
- If it was 30°C a minute ago and suddenly reached 90°C, the machine may be heading toward a serious failure.
- If it has been around 90°C for several hours, it may simply be operating within its normal high-temperature cycle.
A single sensor reading is just a number. But a sequence of readings over time tells a story.
This type of information is known as time-series data. In industrial environments, machines generate thousands of such readings every second. Traditional databases, often used for typical web applications, can struggle when storing and querying large volumes of timestamped data.
Time-series databases are designed specifically for this purpose. They work like security footage for machines, allowing engineers to look back at recent sensor readings and understand whether a machine is moving toward a potentially unsafe condition.
Why GridDB Cloud for Industrial Monitoring
Industrial monitoring systems need a database that can store large amounts of sensor data and allow easy access to recent readings. GridDB Cloud provides an environment where the storage and management of such machine data are handled efficiently, allowing monitoring applications to focus on analyzing system conditions instead of managing database infrastructure.
GridDB is a highly scalable, memory-first NoSQL database designed specifically for high-frequency time-series data, making it well-suited for industrial IoT workloads.
We use GridDB Cloud to:
- Store continuous sensor data using time-series containers with timestamp-based row keys.
- Maintain a fixed schema for predictable and fast reads/writes.
- Ingest data in memory first and persist it safely to disk.
- Query recent time windows efficiently for early-warning detection.
- Correlate multiple sensor streams in real time.
- Replay sensor data before an alert for incident analysis.
- Support explainable alerts by allowing fast access to recent sensor history.
Without GridDB:
- Real-time correlation would be slow.
- High-frequency ingestion would be difficult.
- Incident replay would be inefficient.
System Architecture
In this project, we simulate a simple monitoring system for a sugar mill. For simplicity, we consider three machines and monitor them using sensors that track values such as temperature, vibration, and power usage. The sensor data is generated through a simulator and stored in GridDB Cloud. The system then analyzes recent machine data to check if any unusual patterns appear and shows the results on a monitoring dashboard.
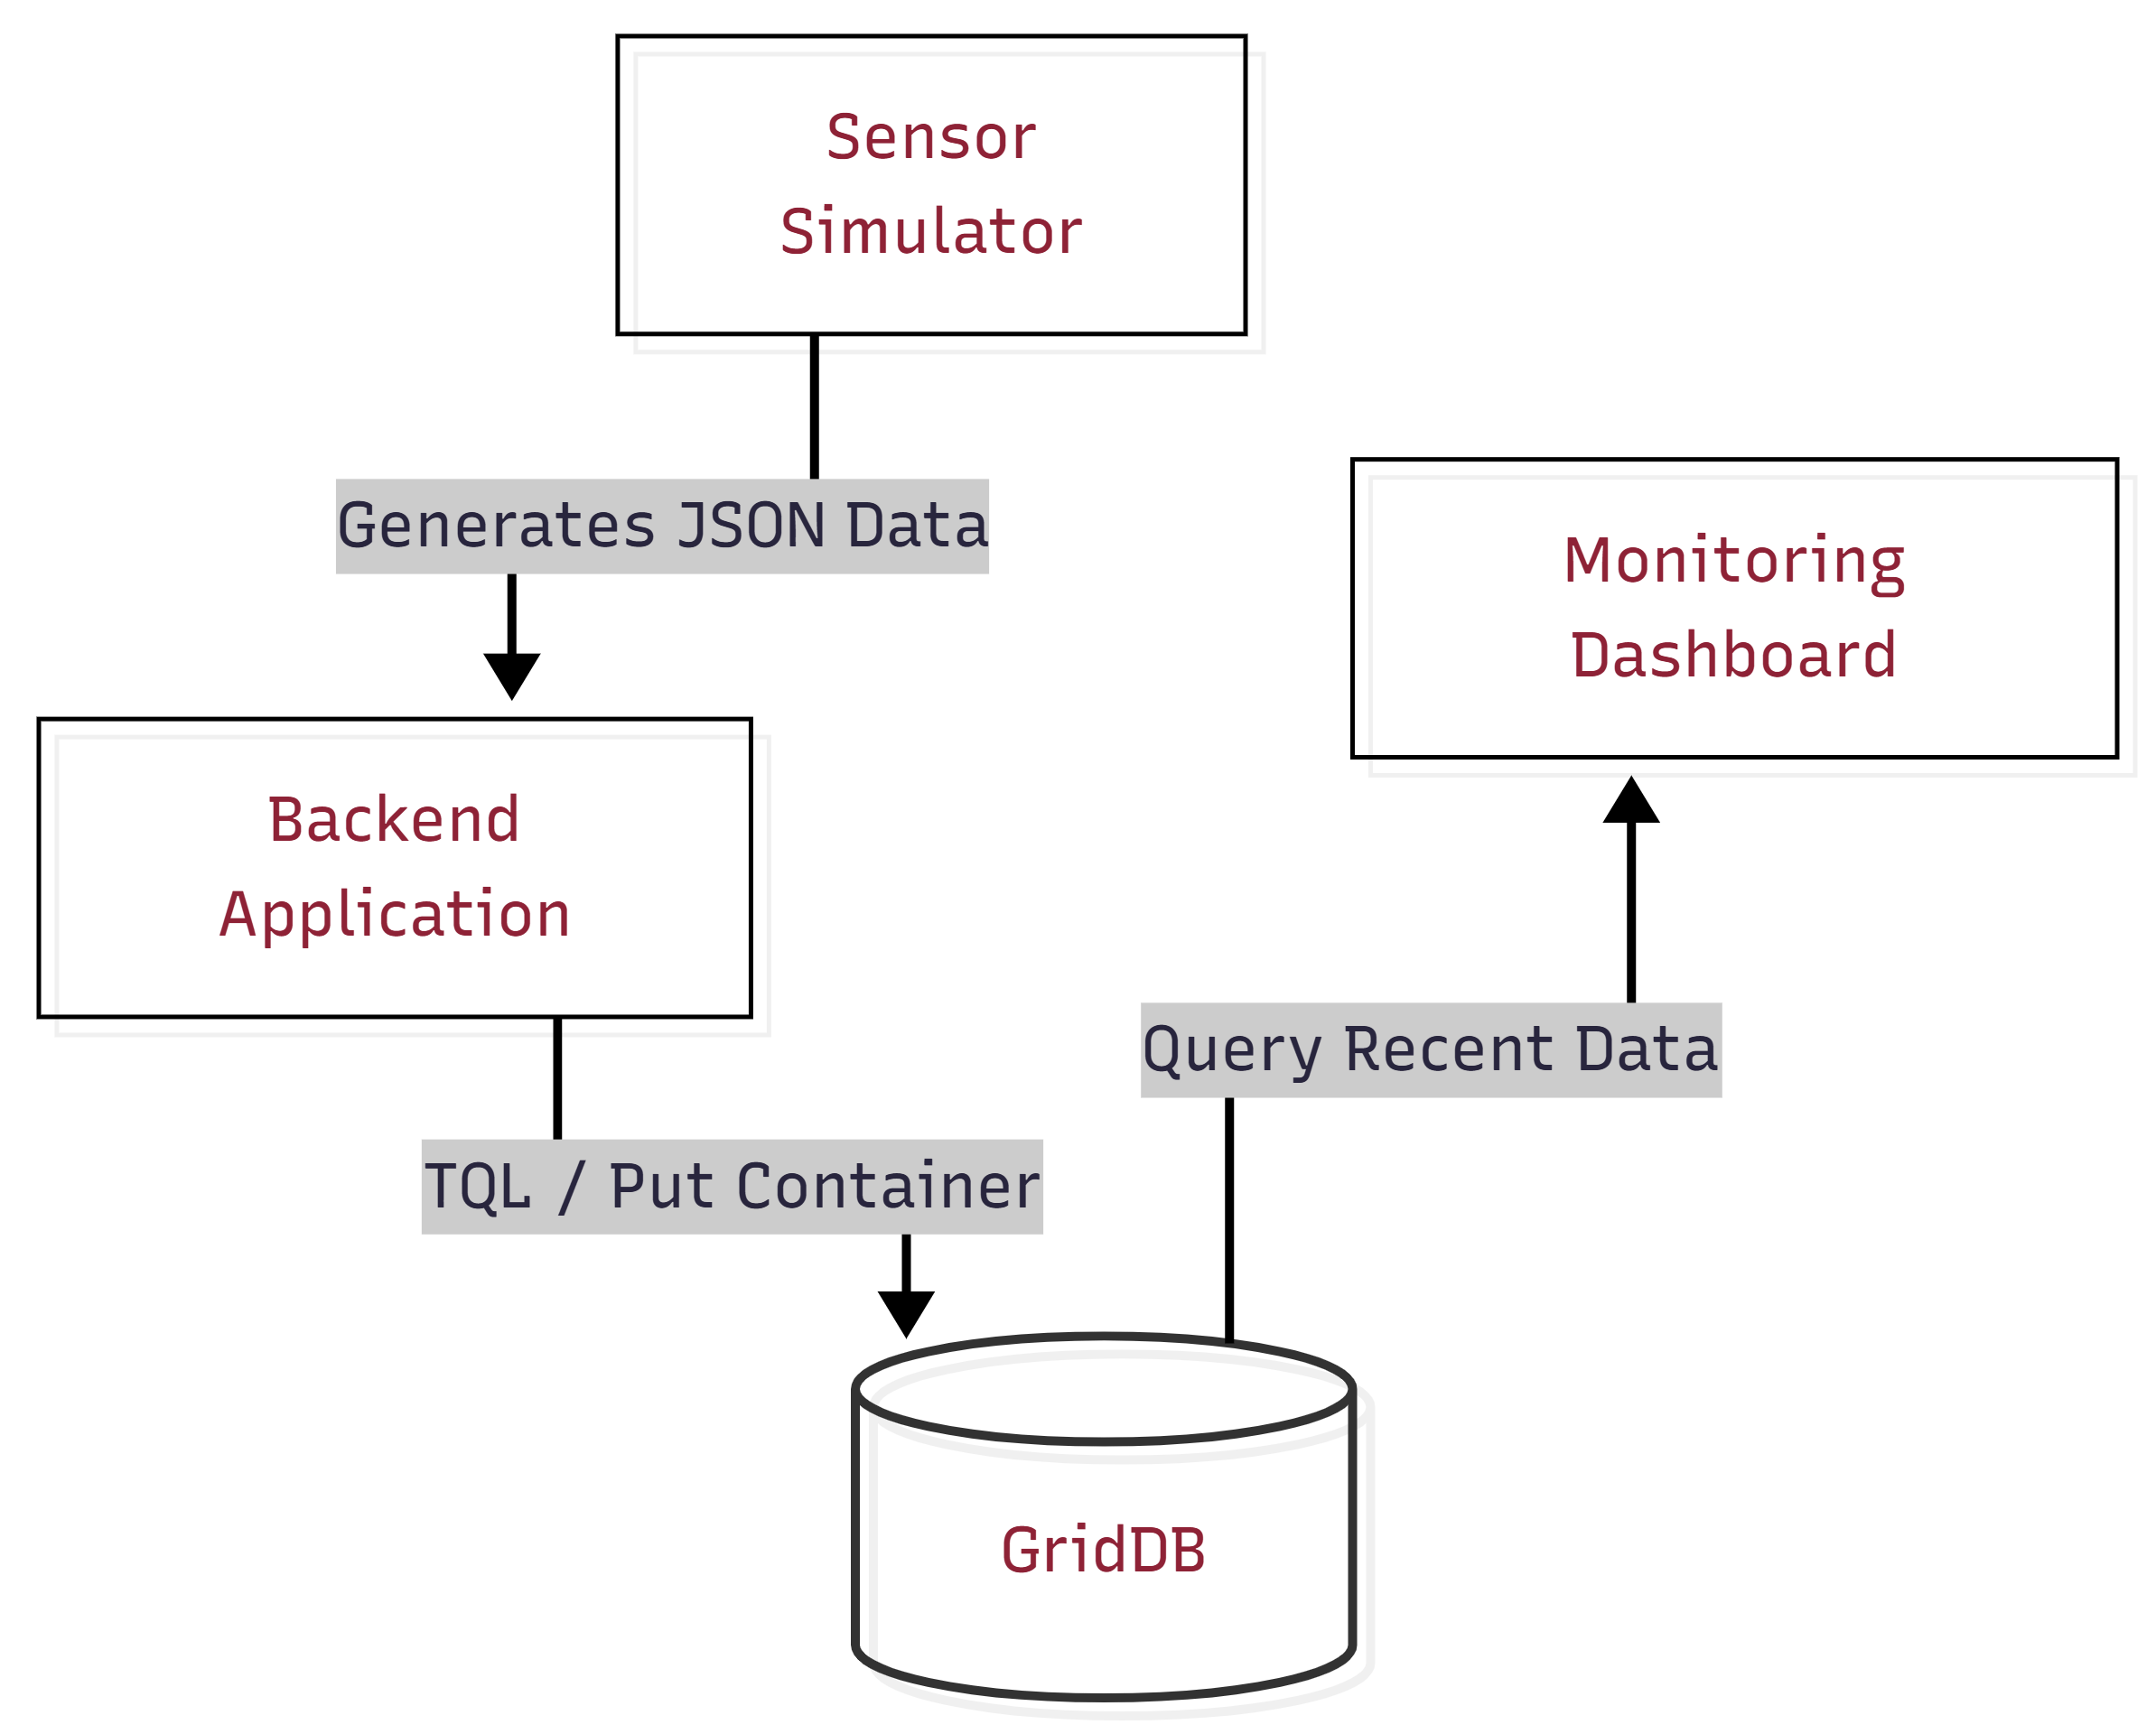
The overall system consists of the following main components:
- Sensor Simulation Layer
A Python-based simulator generates sensor readings for the machines. It produces values such as temperature, vibration, and power usage at regular intervals to imitate how real industrial sensors send data continuously.
- Data Ingestion Layer
The generated sensor readings are processed by the backend application. This layer receives the simulated data and prepares it for storage in the database.
- GridDB Cloud Database
GridDB Cloud stores the machine sensor data generated during the simulation. It acts as the central data layer from which the application can retrieve recent machine readings when evaluating system conditions.
- Monitoring Dashboard
A web-based dashboard displays the machine status and recent alerts. It visualizes sensor values and helps users observe how machine conditions change during monitoring.
Setting Up GridDB Cloud
To store machine telemetry data, a GridDB Cloud instance can be deployed through the Microsoft Azure Marketplace. After subscribing to the service, users receive the cluster connection details including the notification provider address, cluster name, database name, and authentication credentials.
Using the GridDB Python client, applications connect to the GridDB cluster through the native API using the notification provider address provided in the GridDB Cloud dashboard.
The following example shows how a Python application can establish a connection to GridDB Cloud.
import griddb_python as griddb
import threading

_local = threading.local()

def get_store():
    """Return a per-thread GridDB connection to avoid concurrent access errors."""
    if not hasattr(_local, "store") or _local.store is None:
        factory = griddb.StoreFactory.get_instance()
        _local.store = factory.get_store(
            notification_member=NOTIFICATION_MEMBER,
            cluster_name=CLUSTER_NAME,
            database="df321dsdJF",
            username=USERNAME,
            password=PASSWORD
        )
    return _local.store
Once connected, the application can create containers and store the sensor data generated by the monitoring system.
Project Overview
This project builds a smart safety monitoring system for a sugar mill. The system monitors three key machines in the production process – the Boiler, Crusher, and Centrifugal. Different sensor data such as temperature, vibration, and power usage is generated and stored, where it can be analyzed to observe how machine behavior changes over time.
Key ideas behind the system:
- System-wide monitoring: Instead of analyzing machines separately, the system observes how multiple machines behave together.
- Pattern detection: It identifies small but meaningful changes in sensor values that may signal a developing issue.
- Failure propagation awareness: It models how a problem in one machine can affect other machines in the process.
Simulating Industrial Sensor Data
Since real industrial sensors were not available, the system uses a sensor simulator to generate realistic machine telemetry. The simulator creates readings for three machines in a sugar mill:
- Boiler: Measures temperature, vibration, and power usage.
- Crusher: Measures vibration, temperature, and power usage.
- Centrifugal: Measures vibration, temperature, and power usage.
To make the simulation more realistic, the dataset is generated in three phases:
- Normal: All machines operate within safe limits.
- Escalation: The boiler begins to overheat, indicating a developing issue.
- Cascade: The boiler failure spreads to the crusher and then the centrifugal, simulating a chain reaction.
This models how failures in industrial environments often propagate through connected machines rather than occurring in isolation.
To make the simulation mathematically sound and physically realistic, the system avoids generating flat, hardcoded values. Instead, it uses proportional interpolation and random noise to calculate sensor values dynamically:
import random

def interpolate(low, high, progress=None):
    """Smoothly interpolate between two values with optional random progress."""
    if progress is None:
        progress = random.uniform(0.0, 1.0)
    return low + progress * (high - low)

def make_row(ts, machine_id, target_state):
    """Build a realistic sensor row using interpolation instead of hardcoded offsets."""
    t_nrm_low, t_nrm_high = MACHINES[machine_id]["normal"]["temperature"]
    t_warn = MACHINES[machine_id]["thresholds"]["temperature"]["warning"]

    # Add realistic environmental noise
    noise_t = random.uniform(-1.5, 1.5)

    if target_state == "Normal":
        # Calculate normal resting value + physical jitter
        return [ts, interpolate(t_nrm_low, t_nrm_high) + noise_t, ...]

    elif target_state == "Warning":
        # Proportionally ramp upward toward the warning threshold
        prog = random.uniform(0.1, 0.6)
        return [ts, interpolate(t_nrm_high, t_warn, prog) + noise_t, ...]
This approach guarantees that simulated sensors drift naturally within a range (and occasionally spike) rather than resting rigidly at a static median.
The complete implementation can be found in the project repository: github.com/ritigya03/GridDB-Industrial-Safety-Monitoring
Live Escalation Simulation
To demonstrate how failures develop over time, the project also includes a small Python script that simulates a live escalation scenario in the sugar mill.
Instead of inserting a full dataset at once, the script gradually sends sensor readings to GridDB Cloud to mimic how problems evolve in real industrial systems.
The simulation follows three stages:
- Normal Operation – All machines operate within safe limits.
- Boiler Escalation – The boiler temperature gradually increases toward critical levels.
- Cascade Failure – Instability propagates from the boiler to the crusher and eventually to the centrifugal machine.
During the simulation, new sensor readings are continuously inserted into GridDB Cloud. This allows the monitoring system and dashboard to react in real time as the cascade develops.
A simplified example of the escalation trigger is shown below:
def trigger_cascade():
    """Simulates a live cascade that persists until resolved in the dashboard."""
    store = insert_data.get_gridstore()
    start_sim()

    i = 0
    while is_sim_active():
        ts = datetime.now(timezone.utc)
        batch = {}

        for machine_id in MACHINES:
            # Dynamically generate realistic telemetry
            row = make_row(ts, machine_id, determine_phase(i, machine_id))
            batch[MACHINES[machine_id]["container"]] = [row]

        store.multi_put(batch)
        i += 1
        time.sleep(1)
The complete implementation can be found in the project repository: github.com/ritigya03/GridDB-Industrial-Safety-Monitoring
When the user clicks the “Issue Addressed” button in the dashboard, the backend disables the simulation flag. This causes the escalation loop to stop, and the script injects a final batch of normal sensor readings into GridDB Cloud. These healthy readings immediately restore the system to a stable state on the monitoring dashboard.
Storing Sensor Data in GridDB Cloud
After generating the simulated sensor readings, the data is stored in GridDB Cloud so it can be accessed by the monitoring system. Each machine is assigned its own TIME_SERIES container, where readings such as timestamp, temperature, vibration, and power consumption are stored. The timestamp acts as the key for each record, allowing the system to store and query machine telemetry in chronological order. Once the containers are created, the generated sensor dataset is inserted into GridDB so it can be used for monitoring and analysis.
Creating a TIME_SERIES container
def create_container(store, container_name):
    con_info = griddb.ContainerInfo(
        container_name,
        [
            ["timestamp",   griddb.Type.TIMESTAMP],
            ["temperature", griddb.Type.DOUBLE],
            ["vibration",   griddb.Type.DOUBLE],
            ["power",       griddb.Type.DOUBLE],
        ],
        griddb.ContainerType.TIME_SERIES
    )

    return store.put_container(con_info)
The complete implementation can be found in the project repository: github.com/ritigya03/GridDB-Industrial-Safety-Monitoring
Inserting Data into GridDB Cloud
from datetime import datetime

def insert_data(store, dataset):
    batch = {}

    for machine_id, readings in dataset.items():
        container_name = MACHINES[machine_id]["container"]

        rows = []
        for r in readings:
            ts = datetime.fromisoformat(r["timestamp"].replace("Z", "+00:00"))
            rows.append([ts, r["temperature"], r["vibration"], r["power"]])

        batch[container_name] = rows

    store.multi_put(batch)
The complete implementation can be found in the project repository: github.com/ritigya03/GridDB-Industrial-Safety-Monitoring
The multi_put operation allows rows for multiple containers to be written in a single request. This significantly improves ingestion efficiency when handling continuous machine telemetry streams.
Continuous Telemetry Stream
In addition to inserting the initial dataset, the system also supports a background data producer that continuously sends normal machine telemetry to GridDB Cloud.
This producer acts as a heartbeat, ensuring that the monitoring dashboard always receives fresh sensor data. When the escalation simulation is triggered, the producer automatically pauses to avoid overwriting the simulated failure sequence. Once the simulation ends, the producer resumes sending healthy readings, allowing the system to recover naturally.
Querying Sensor Data and Detecting Pre-Incident Conditions
Once sensor data is stored in GridDB Cloud, the monitoring system queries recent readings to evaluate machine conditions. The system retrieves the latest records for each machine and analyzes whether sensor values are approaching unsafe ranges.
GridDB’s Time-Series Query Language (TQL) allows the system to efficiently fetch the most recent sensor readings from each machine container.
def query_recent(store, machine_id, limit=20):
    container = store.get_container(MACHINES[machine_id]["container"])

    query = container.query(f"select * order by timestamp desc limit {limit}")
    rs = query.fetch()

    readings = []
    while rs.has_next():
        row = rs.next()
        readings.append({
            "temperature": row[1],
            "vibration": row[2],
            "power": row[3],
        })

    return readings
The complete implementation can be found in the project repository: github.com/ritigya03/GridDB-Industrial-Safety-Monitoring
To avoid sudden status flickering near thresholds, the system evaluates machine conditions using a small rolling window of recent readings. By averaging the latest values, the monitoring logic becomes more stable and resistant to temporary sensor noise.
def machine_risk_score(machine_id, avg_t, avg_v, avg_p):
    """Calculates a 0–100 risk score based on continuous sensor severity."""

    s_t = sensor_severity(avg_t, nrm["temperature"][1], thr["temperature"]["warning"], thr["temperature"]["critical"])
    s_v = sensor_severity(avg_v, nrm["vibration"][1],   thr["vibration"]["warning"],   thr["vibration"]["critical"])
    s_p = sensor_severity(avg_p, nrm["power"][1],       thr["power"]["warning"],       thr["power"]["critical"])

    weighted = (
        s_t * SENSOR_WEIGHTS["temperature"] +
        s_v * SENSOR_WEIGHTS["vibration"] +
        s_p * SENSOR_WEIGHTS["power"]
    )

    return min(round(weighted * 100), 100)
The complete implementation can be found in the project repository: github.com/ritigya03/GridDB-Industrial-Safety-Monitoring
Risk Scoring
Instead of a simple status label, each machine also receives a continuous risk score (0–100) based on exactly how far its sensor values have drifted from safe ranges.
For example, a boiler at 89°C and a boiler at 200°C both count as “Critical” in a simple system. With continuous scoring, the second scenario scores significantly higher because it is far more dangerous.
The fleet-wide score is a weighted average across all machines — the boiler contributes more to the overall score because a boiler failure affects everything downstream. Active cascade conditions add extra penalty points on top.
Cascade Detection
The system understands that machines in a sugar mill are connected. If the boiler fails, the crusher that depends on its steam will eventually be affected too. These relationships are defined as rules:
CASCADE_RULES = [
    {"source": "boiler",  "target": "crusher",    "message": "Boiler instability propagating to Crusher..."},
    {"source": "crusher", "target": "centrifugal", "message": "Crusher anomaly affecting Centrifugal..."},
    {"source": "boiler",  "target": "centrifugal", "message": "Full-Chain Cascade detected..."},
]
When a source machine is in a dangerous state and its downstream target also shows elevated readings, a cascade alert is triggered on the dashboard.
Building the Monitoring Dashboard
Visualization plays an important role in the monitoring system. To make machine conditions easier to understand, a web-based dashboard was created that displays machine status, sensor readings, cascade alerts, and the overall system risk score in real time. The interface is built using HTML, JavaScript, and Chart.js, which provides interactive charts for visualizing machine telemetry.
The backend exposes a set of simple API endpoints that the dashboard polls periodically to retrieve updated monitoring data.
| Endpoint | What it returns |
|---|---|
GET /api/fleet |
(Main) Status of all machines + cascade alerts + risk score |
GET /api/machine/ |
Sensor history for a single machine (used for charts) |
GET /api/timeline |
Log of escalation events over time |
Below is a simplified example from the dashboard script showing how the system fetches fleet data and updates the interface.
async function pollFleet() {
    try {
        const res  = await fetch('/api/fleet');
        const data = await res.json();

        // Update each machine card
        for (const [machineId, status] of Object.entries(data.machines)) {
            setStatus(machineId, status.status, status.message, status.latest);
        }

        renderCascades(data.cascades || []);
        updateRiskScore(data.risk_score ?? 0);

    } catch(e) {
        console.error('Fleet poll failed', e);
    }
}
The complete implementation can be found in the project repository: github.com/ritigya03/GridDB-Industrial-Safety-Monitoring
The dashboard calls the fleet endpoint every few seconds to keep the interface synchronized with the latest machine data stored in GridDB Cloud. Additional endpoints provide sensor history and timeline events, which are used to render trend charts and escalation timelines for operators.
Running the Project
Make sure GridDB Cloud is running and credentials are configured as environment variables. Then run the following in order:
# Step 1: Create containers and seed historical data
$ python src/insert_data.py

# Step 2: Start the monitoring backend
$ python src/app.py

# Step 3 (optional): Keep dashboard alive with a live heartbeat
$ python src/insert_data.py --live

# Step 4 (optional): Trigger a live cascade demo
$ python src/simulate_escalation.py
Open http://localhost:5000 to view the dashboard.
To make the demonstration clear and repeatable, the project uses two separate data-feeding mechanisms:
- The Background Heartbeat (
insert_data.py --live): This script provides a stable, healthy baseline so the dashboard stays active and “green” by default. - The Manual Escalation (
simulate_escalation.py): This script temporarily “takes over” the dashboard with a developing incident to show how failures propagate.
One of the key advantages of using GridDB is how it handles automatic recovery. Once the escalation script finishes, the background producer continues to send “Normal” data. These new healthy readings eventually “drown out” any temporary critical spikes, and the system automatically returns to a safe state without requiring a manual reset.
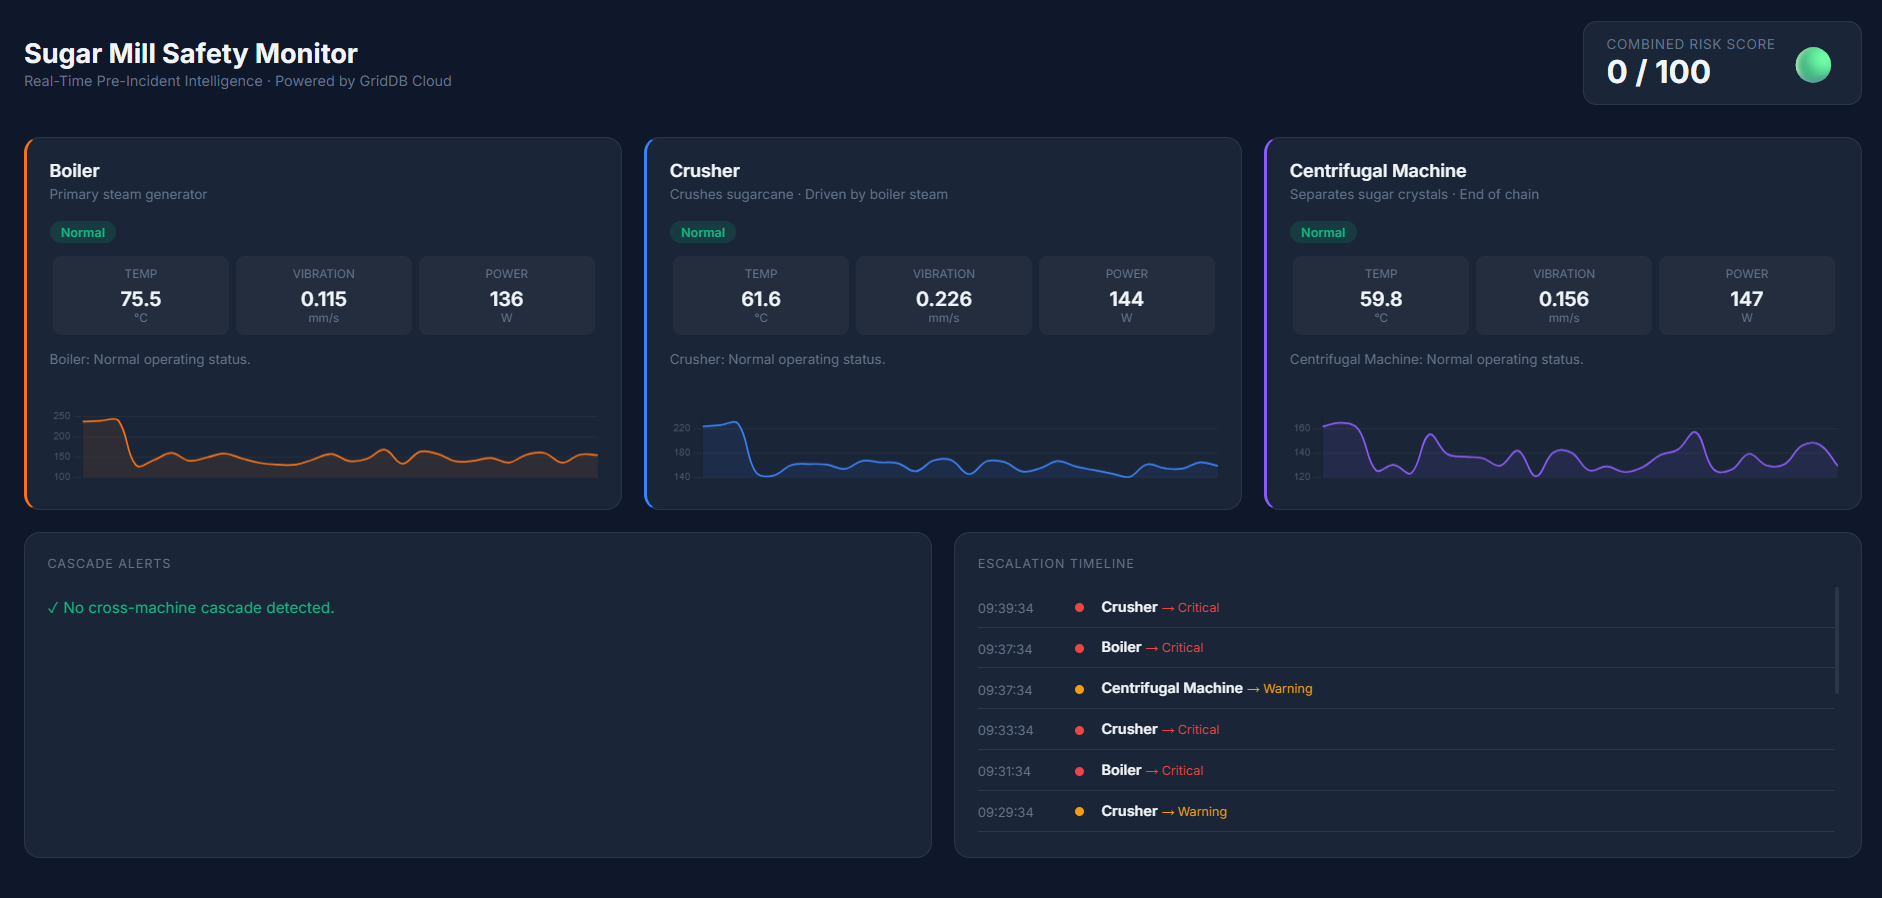
Results and Dashboard Overview
After running the system, the monitoring dashboard displays the real-time status of all machines in the sugar mill simulation. The interface shows sensor readings for temperature, vibration, and power consumption, along with the current safety status of each machine.
Normal Operation
In the normal state, all machines operate within safe limits. The dashboard displays a low overall risk score and indicates that the factory is running under normal conditions.
As sensor values begin drifting toward warning thresholds, the system detects early warning patterns. Individual machines may enter a Warning state, and the overall risk score begins to increase.
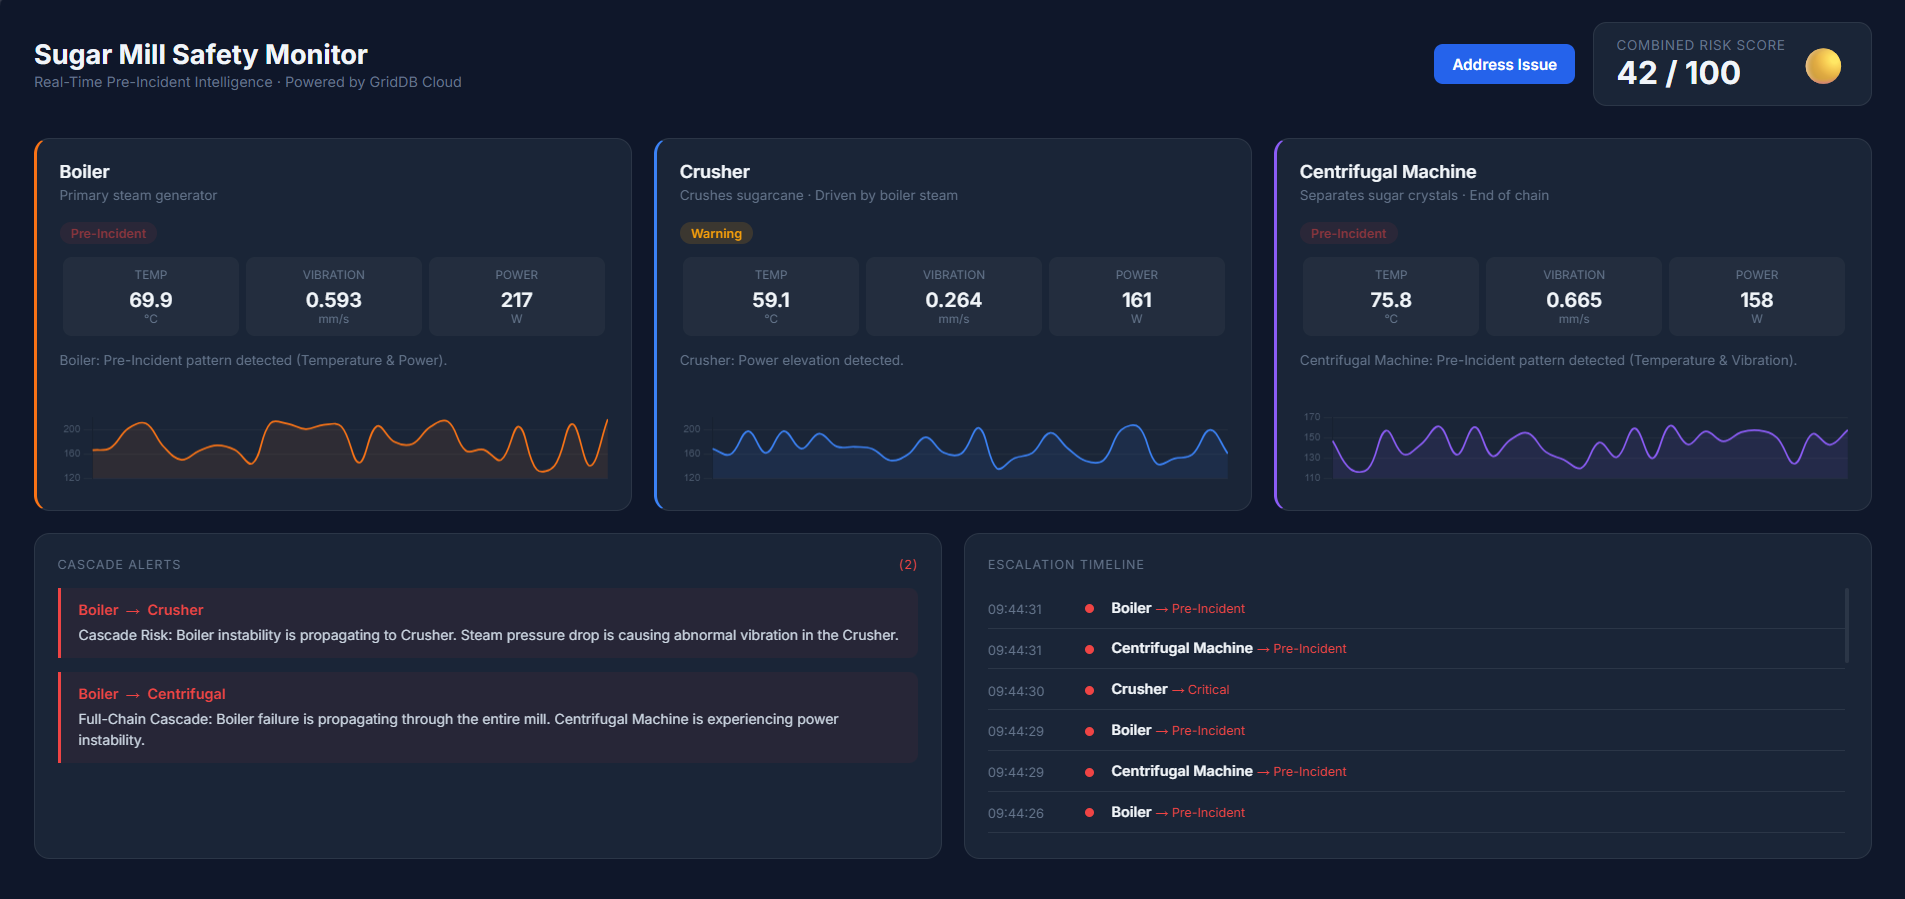
When multiple sensors exceed warning thresholds simultaneously, the system identifies a Pre-Incident condition. If instability spreads between machines, the dashboard highlights cascade alerts to indicate a potential chain reaction across the production process.
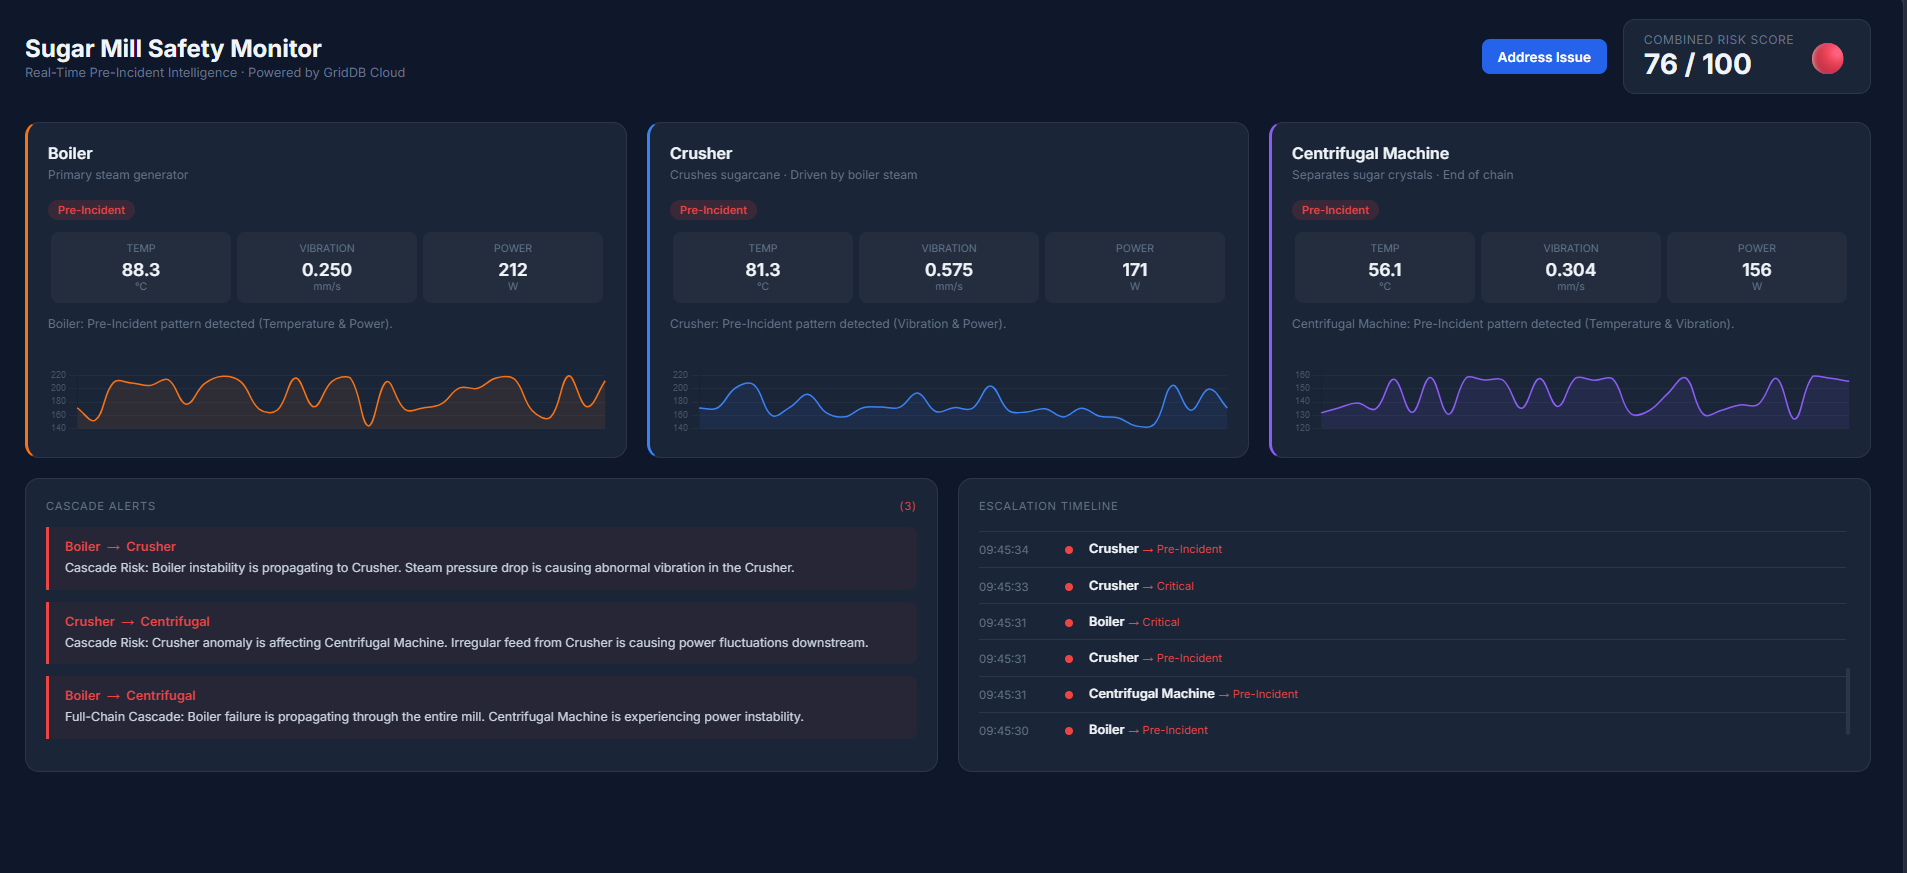
Once the issue is addressed and sensor readings return to safe ranges, the monitoring system automatically returns to a stable state. The dashboard updates in real time, clearing cascade alerts and lowering the system risk score.
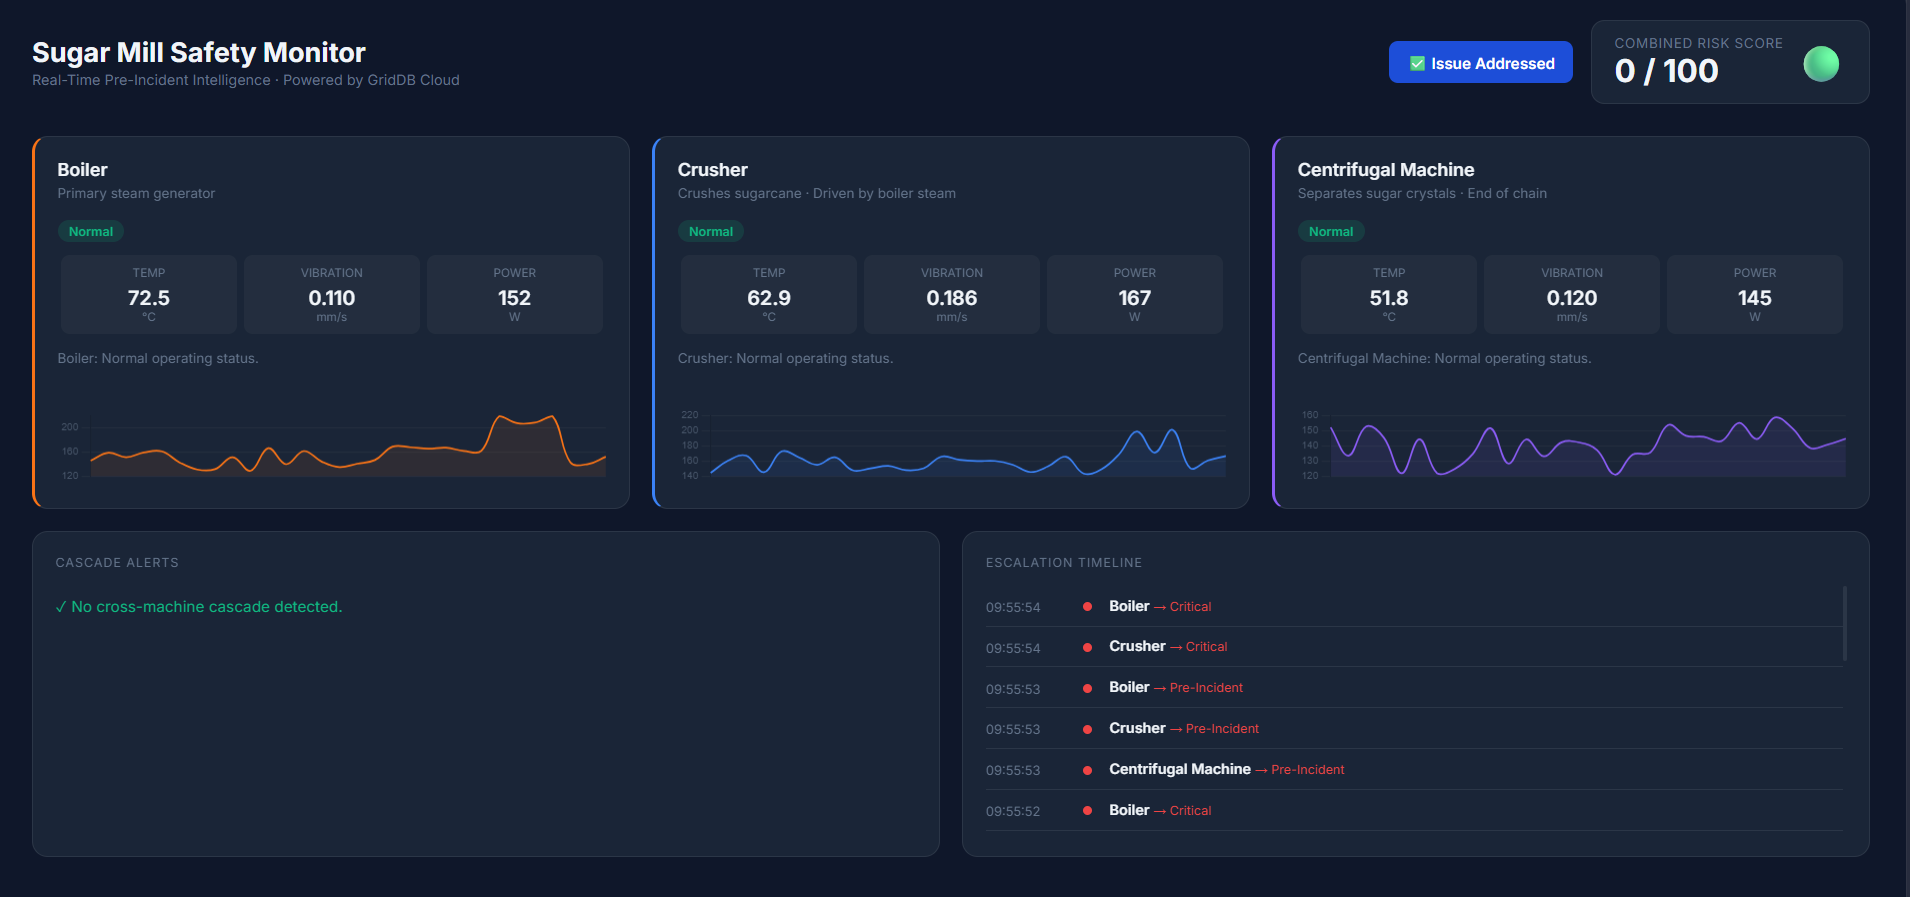
By visualizing machine telemetry, cascade alerts, and system risk levels together, the dashboard provides operators with a clear operational overview of the factory. This helps engineers detect early warning patterns and respond before issues escalate into serious failures.
Conclusion
Industrial accidents often develop gradually through small changes in machine behavior rather than sudden failures. Detecting these early signals requires systems that can store large volumes of sensor data and analyze how machine conditions evolve over time.
In this project, we built a simple safety monitoring prototype using GridDB Cloud to store and query machine telemetry data. By combining simulated sensor readings with rule-based analysis, the system can detect early warning patterns and potential cascade failures across machines.
In the future, this approach could be extended with machine learning models trained on historical sensor data in GridDB, enabling more advanced predictive maintenance and anomaly detection.