Fluentd is one of the most widely deployed log collectors in the world, and log ingestion is one of the workloads GridDB was built for: high-volume, append-heavy, time-stamped data. In this article we wire the two together using the fluent-plugin-griddb output plugin and GridDB Cloud, and then keep increasing the ingestion rate until something gives. As a brief summary: one small VM went from 15,000 to 150,000 rows per second by changing a single buffer parameter, and when we then quadrupled the collector hardware to push past that, throughput barely moved. We found the ceiling, and the way it shows up is more interesting than the number itself: not errors, not rejections, but quiet backpressure.
Along the way we’ll cover a realistic installation (the plugin targets an older Ruby, so there is some dependency archaeology involved), a small patch the plugin needs before its buffered mode works, the container schema gotchas that the Web API’s positional row format will happily punish you for, and a version-drift bug that dressed itself up as a TLS problem.
Why Fluentd
GridDB has steadily grown its connector ecosystem: Kafka, JDBC, Grafana, and a range of collection agents can all read from or write to GridDB, which means it usually slots into an existing data pipeline rather than demanding a new one. Fluentd is a natural addition to that list. It is the de facto standard for log collection in a lot of Kubernetes and traditional server environments, it has hundreds of input and parser plugins, and once events are flowing through it, pointing them at GridDB is a single
Everything in this post talks to GridDB Cloud through its Web API: JSON rows over HTTPS; it works from anywhere without special client libraries, and, as the numbers below will show, with sensible batching it moves more data than most logging workloads will ever generate.
Installation
For installation, fluent-plugin-griddb targets Ruby 2.7 and Fluentd 1.12. Ruby 2.7 predates OpenSSL 3, which is what modern Ubuntu ships, so Ruby will not compile against the system OpenSSL. The fix is to build OpenSSL 1.1.1 from source into its own prefix, build Ruby 2.7.2 against it with rbenv, and then pin RubyGems, Bundler, and Fluentd to the last versions that still support Ruby 2.7. It sounds worse than it is; each step is mechanical.
1. System dependencies
$ sudo apt update
$ sudo apt install -y git curl build-essential libreadline-dev zlib1g-dev \
libyaml-dev libncurses5-dev libffi-dev libgdbm-dev
2. OpenSSL 1.1.1 from source
$ cd /tmp
$ wget https://www.openssl.org/source/openssl-1.1.1w.tar.gz
$ tar xvfz openssl-1.1.1w.tar.gz
$ cd openssl-1.1.1w
$ ./config --prefix=/opt/openssl-1.1.1w --openssldir=/opt/openssl-1.1.1w shared zlib
$ make -j$(nproc)
$ sudo make install
One step that is easy to miss: the freshly built OpenSSL has an empty certificate directory, so anything compiled against it will fail TLS verification, including HTTPS calls to GridDB Cloud. Point it at the system certificate store:
$ sudo rm -rf /opt/openssl-1.1.1w/certs
$ sudo ln -s /etc/ssl/certs /opt/openssl-1.1.1w
3. rbenv and Ruby 2.7.2
Install rbenv, but pull ruby-build directly from GitHub. The version definitions that come with the packaged rbenv are stale and may not build 2.7.2 cleanly:
$ sudo apt install -y rbenv
$ mkdir -p "$(rbenv root)"/plugins
$ git clone https://github.com/rbenv/ruby-build.git "$(rbenv root)"/plugins/ruby-build

$ RUBY_CONFIGURE_OPTS="--with-openssl-dir=/opt/openssl-1.1.1w" rbenv install 2.7.2
$ rbenv global 2.7.2
$ echo 'eval "$(rbenv init - bash)"' >> ~/.bashrc
$ source ~/.bashrc
$ ruby --version   # should report 2.7.2
4. Fluentd and the plugin
Ruby 2.7 also needs older RubyGems and Bundler; the current releases of both have dropped support. Pin them, then install Fluentd 1.12.0 and the plugin gem:
$ gem update --system 3.4.22
$ gem install bundler -v 2.4.22
$ gem install fluentd --version "1.12.0" --no-doc
$ rbenv rehash

$ gem install --force --local fluent-plugin-griddb-1.0.2.gem
$ rbenv rehash
A quick fluentd --version confirms the pipeline pieces are in place. And make sure it is 1.0.2 of the plugin specifically; more on why in a moment.
Patching the Plugin
Version 1.0.2 of the plugin has a latent bug: it works in its default, unbuffered mode, but the moment you add a
$ error_class=NoMethodError error="undefined method `handle_record' for
#<Fluent::Plugin::GriddbOutput> Did you mean?  handle_create_container"
Inside out_griddb.rb, the unbuffered process path routes records through a method called handle_insert_type, which works. The buffered write(chunk) path calls handle_record, which was never implemented. Every chunk raises, gets flagged as a bad chunk, and is shunted to Fluentd’s backup directory. The fix is one line: make the buffered path call the same method the working path uses.
$ sed -i 's/handle_record(record_array)/handle_insert_type(record_array)/' \
$   "$(gem which fluent/plugin/out_griddb)"
Note the use of gem which to locate the file. If you have the plugin’s source repository checked out as well as the gem installed, it is easy to edit the wrong copy and wonder why nothing changed. gem which fluent/plugin/out_griddb tells you exactly which file Fluentd loads.
Two related notes while we are in the plugin internals. First, the plugin’s insert_type parameter accepts single and multiple, but multiple is currently a stub that logs “Currently insert type only support for single type” and does nothing, so leave it on single. Second, and this matters for the results later: even in single mode, the buffered path sends an entire buffer chunk in one HTTP request. So batch size is controlled by the buffer’s chunk settings, not by the insert type.
Creating the Target Container
The Web API inserts rows positionally: each row arrives as an array of values, matched to columns strictly by order. That makes the container schema definition load-bearing in a way that name-based systems are not, and it produced two instructive failures before the schema below worked.
The event we will generate has six fields, plus a seq counter that Fluentd’s sample input appends to the end of each record. Appends, as in: seq arrives as the last value in the row, so it must be the last column in the schema. Defining it first produces The specified data cannot be converted to LONG type as the host string lands in the seq slot. Defining extra columns the record does not send (say, copying the schema of an apache-parsed container with user and referer fields) produces Row data is invalid from the value-count mismatch.
The schema that matches what the plugin actually sends:
$ curl -X POST \
$   -u "$GRIDDB_USER:$GRIDDB_PASS" \
$   -H 'Content-Type: application/json' \
$   "$GRIDDB_WEBAPI_URL/dbs/$GRIDDB_DB/containers" \
$   -d '{
$     "container_name": "fluentdStress",
$     "container_type": "COLLECTION",
$     "rowkey": false,
$     "columns": [
$       {"name": "host",   "type": "STRING"},
$       {"name": "method", "type": "STRING"},
$       {"name": "path",   "type": "STRING"},
$       {"name": "code",   "type": "INTEGER"},
$       {"name": "size",   "type": "INTEGER"},
$       {"name": "agent",  "type": "STRING"},
$       {"name": "seq",    "type": "LONG"}
$     ]
$   }'
Or you can use the GridDB Cloud CLI Tool: griddb-cloud-cli create -i.
We use a COLLECTION with rowkey false rather than a time-series container on purpose. A time-series container upserts on duplicate timestamps, and at tens of thousands of rows per second many events share a millisecond. A throughput test against a time-series container without a carefully unique key silently measures overwrites while reporting success. A rowkey-less collection accepts every insert as a distinct row, which is what we want to count.
The Stress Configuration
For a throughput test, tailing a log file written by a generator makes the generator and the disk the bottleneck. Fluentd’s built-in sample input creates events in memory instead, which lets us dial the input rate directly:
$ <system>
$   workers 4                # match your core count
$ </system>

$ <source>
$   @type sample
$   tag stress.griddb
$   size 200                # events per emit
$   rate 50000              # events per second
$   auto_increment_key seq  # unique trailing counter per event
$   dummy {"host":"10.0.0.1","method":"GET","path":"/api/v1/users","code":200,"size":4096,"agent":"gridstress/1.0"}
$ </source>

$ <match stress.griddb>
$   @type griddb
$   host      "$GRIDDB_CLOUD_HOST"
$   cluster   "$GRIDDB_CLUSTER"
$   database  "$GRIDDB_DB"
$   container "fluentdStress"
$   insert_mode "append"
$   insert_type "single"
$   username  "$GRIDDB_USER"
$   password  "$GRIDDB_PASS"

$   <buffer>
$     @type memory
$     chunk_limit_records 50000    # rows per HTTP request: the knob that matters
$     chunk_limit_size    64MB
$     flush_thread_count  8
$     flush_mode          interval
$     flush_interval      1s
$     flush_thread_interval 0.1
$     total_limit_size    4GB
$     retry_max_times     3
$     retry_type          periodic
$     retry_wait          1s
$     overflow_action     throw_exception
$   </buffer>
$ </match>
The parameters worth understanding: chunk_limit_records sets how many rows travel in each PUT to the Web API, flush_thread_count sets how many of those requests run in parallel, and workers in the system block spreads the whole pipeline across CPU cores. Everything else is safety plumbing: total_limit_size bounds the memory buffer, and overflow_action throw_exception makes backpressure loud instead of silent, which is exactly what you want when the point of the exercise is to see what breaks.
Measuring
Fluentd’s own logs tell you what it sent; they do not tell you what the database kept. The only number that counts is the row count in the container, so we sample it and compute the delta over the actual elapsed time:
$ A=$(griddb-cloud-cli sql query -s "select count(*) from fluentdStress" \
$     | grep -o '"Value":[0-9]*' | grep -o '[0-9]*'); T1=$(date +%s)
$ sleep 60
$ B=$(griddb-cloud-cli sql query -s "select count(*) from fluentdStress" \
$     | grep -o '"Value":[0-9]*' | grep -o '[0-9]*'); T2=$(date +%s)
$ echo "confirmed rows/sec: $(( (B - A) / (T2 - T1) ))"
One measurement lesson learned the hard way: divide by real elapsed time, not the interval you asked for. Once the container holds tens of millions of rows, count(*) itself takes several seconds, and a sampler that assumes its nominal interval will overstate throughput badly. And confirmed rows per second, measured at the destination, is the honest metric. If Fluentd claims success while this number lags what was sent, rows are being dropped somewhere. In our runs that gap never appeared: everything sent was stored.
Round One: Batch Size Is the Whole Game
All single-node runs use the same event shape. The only variables changed between runs are the chunk size and the worker count.
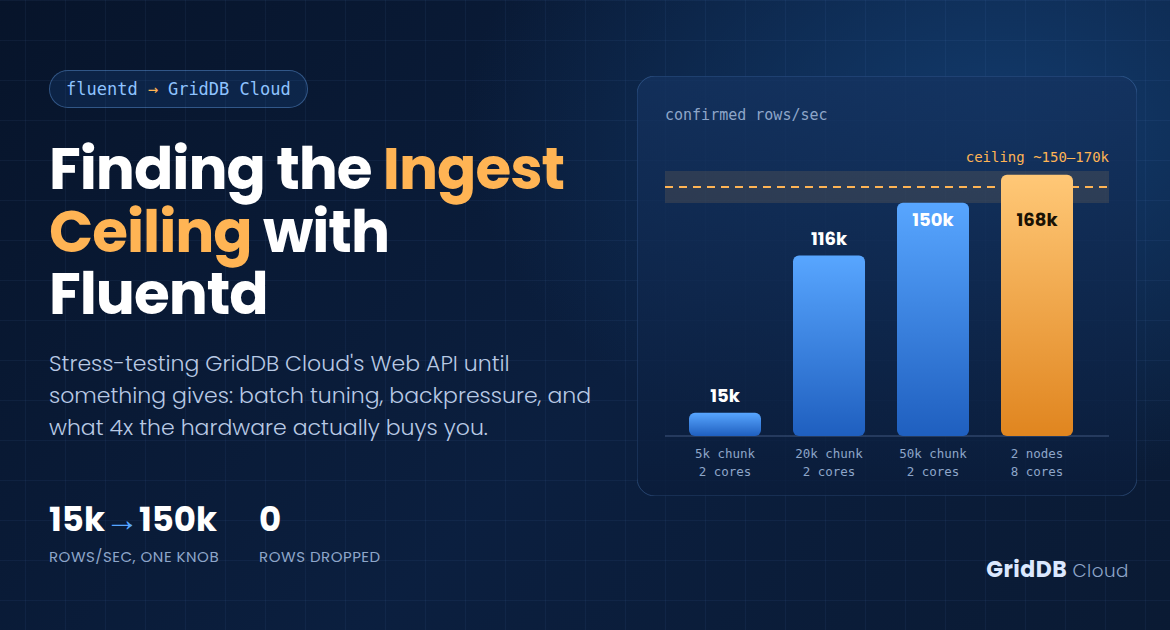
| chunk_limit_records | workers | node(s) | sustained rows/sec |
|---|---|---|---|
| 5,000 | 1 | 1 x 2-core | ~15,000 |
| 20,000 | 2 | 1 x 2-core | ~116,000 |
| 50,000 | 2 | 1 x 2-core | ~150,000 |
The leap from 15k to 150k comes almost entirely from batching. Per-request overhead, HTTP, TLS, JSON framing, is fixed cost; the more rows amortize it, the closer you get to the pipeline’s real capacity. And do the request math: at 150,000 rows per second in 50,000-row chunks, the client is making roughly three HTTP requests per second. This resolves a confusion that comes up constantly with cloud database quotas: platform limits are typically expressed against requests and connections, not rows, and a well-batched pipeline moves enormous row volume through a trickle of requests. Row throughput and request rate are independent axes.
Round Two: More Hardware, Same Ceiling
To push the ingestion even further, we figured would throw in more cores and more nodes. So: two VMs, 4 cores each, 4 Fluentd workers each, identical configs, both writing to the same container. Eight workers across eight cores, four times the collector CPU that produced the 150k number.
Setting up the second node produced a bug worth recounting, because it disguised itself well. The second machine’s Fluentd immediately failed every request with:
400 The plain HTTP request was sent to HTTPS port
Microsoft-Azure-Application-Gateway/v2
The configs were byte-identical. OpenSSL versions matched. Certificate symlinks matched. No proxy variables anywhere. The actual cause: gem install fluent-plugin-griddb without a version pin had installed 1.0.1 on the new box instead of 1.0.2, and 1.0.1 handles the URL scheme differently, quietly speaking plaintext HTTP to port 443. A minor plugin version drift between two “identical” nodes produced what looked exactly like a TLS or gateway misconfiguration. Pin your plugin versions across a fleet. And remember that reinstalling the gem also wipes the handle_record patch, which must be reapplied on every fresh install.
With both nodes on patched 1.0.2, the combined result over a sustained run:
| configuration | total collector cores | sustained rows/sec (combined) |
|---|---|---|
| 1 node, 2 cores | 2 | ~150,000 |
| 2 nodes, 4 cores each | 8 | ~168,000 |

Quadrupling collector capacity bought about 12%. That flatline is the signature of a shared ceiling downstream of the collectors: somewhere in GridDB Cloud’s ingest path, whether the database engine or the Azure Application Gateway fronting it, the pipeline saturates around 150-170k rows per second on this plan.
What the Ceiling Looks Like
Here is the part that matters for anyone running this in production: the ceiling does not announce itself with errors. There were no 429s, no 503s, no failed inserts, no dropped rows at any point. Every single request returned success. What changed was latency. Buffer flushes that normally complete in about a second began taking 20 to 29 seconds:
$ [warn]: #1 buffer flush took longer time than slow_flush_log_threshold:
$         elapsed_time=26.086 slow_flush_log_threshold=20.0
$ [warn]: #2 buffer flush took longer time than slow_flush_log_threshold:
$         elapsed_time=27.094 slow_flush_log_threshold=20.0
$ [warn]: #3 buffer flush took longer time than slow_flush_log_threshold:
$         elapsed_time=28.739 slow_flush_log_threshold=20.0
Under sustained saturation, throughput oscillates between roughly 120k and 190k rows per second as flush queues build and drain. GridDB Cloud applies backpressure by slowing acceptance, not by rejecting requests. That is graceful behavior, nothing is lost, but it has a monitoring consequence: an alerting setup that watches only error rates will report a perfectly healthy pipeline while ingest latency has grown by 25x. Watch flush duration, not just status codes.
Conclusion & Takeaways
Tune the buffer before anything else. The difference between a naive Fluentd-to-GridDB config and a tuned one is an order of magnitude, and it is almost entirely chunk_limit_records. If your pipeline feels slow, your batches are almost certainly too small.
One well-tuned node covers most workloads. A single 2-core VM sustained 150,000 rows per second. Before scaling out collectors, check whether you are anywhere near that; most logging workloads are not.
The ceiling is real, and it is polite. Around 150-170k rows per second on this plan, the ingest path saturates regardless of collector count. It degrades by latency, not by error, so monitor flush duration. Sent and stored never diverged: even at saturation, nothing was dropped.
Pin plugin versions across nodes. A one-patch-version drift between two collectors produced a protocol-level failure that looked like a TLS misconfiguration. Fleet consistency is not optional.
Measure at the destination, against real elapsed time. count(*) deltas are the ground truth, and they get slow as the container grows; divide by actual seconds or your numbers flatter you.
The Web API, for its part, holds up incredibly well. JSON over HTTPS carries overhead, and the native transport would spend fewer cycles per row. But sustaining 150,000+ rows per second, error-free, through the least exotic interface imaginable is more ingest than the vast majority of logging workloads will ever need. We set out to break GridDB Cloud, and the closest we got was making it take a little longer to say yes.